Figure 1.
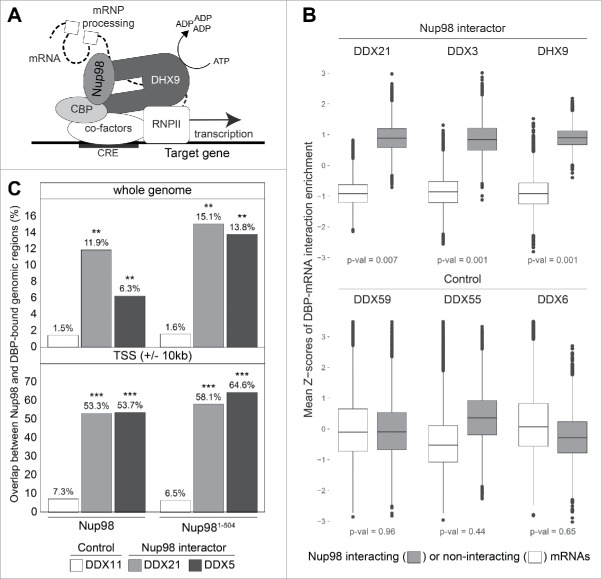
Nup98 and select DBPs interact with a shared set of mRNAs and gene loci. (A) Diagram depicting Nup98 (medium gray) and DHX9 (dark gray) at the promoter of a gene containing a cAMP responsive element (CRE) (indicated as a black box) participating in gene transcription and pre-mRNA processing. The diagram is based on the direct interactions of DHX9 with CBP (light gray), Nup98 with DHX9, and these factors with shared gene loci (black line) and transcripts (dashed line). In this model, Nup98 stimulates DHX9 ATPase activity to induce DHX9-mediated, CBP-dependent activation of RNA Pol II transcription, with Nup98-DHX9 further interacting with the pre-mRNA to regulate processing (e.g., splicing). (B) mRNA interaction data for select DBPs that bind (DDX21, DDX3, and DHX9)54-56 or do not bind (DDX59, DDX55 and DDX6)59,60 Nup98. Based on published RIP-seq data, the transcripts interacting with each DBP were categorized into Nup98-interacting (gray) or non-interacting (white) mRNAs.53,61 Bootstrapped means of mRNA enrichment for these 2 categories of DBP-interacting transcripts were calculated and transformed into Z-scores. Box plots show average Z-scores for mRNAs known to interact with Nup98 (gray) vs. those that show no Nup98 interaction (white), with the median represented by a horizontal line, 50% of the data present within the box, and the whiskers indicating the maximum and minimum values (outliers are shown as points). P-values were obtained by label permutation tests (Nup98 interacting or non-interacting mRNAs) via Monte-Carlo resampling and they are shown at the bottom of the graphs. (C) Analysis of published data14,55,57,58 to compare genomic regions bound to full length Nup98 or the nucleoplasmic Nup981-504 truncation with DBPs detected (DDX21 and DDX5)55,57 or not detected (DDX11)58 with immunopurified Nup98.7,61 Plots show the percent overlap of genomic regions (peaks) in the entire genome (top) or at genomic regions close (+/− 10 kb) to the transcriptional start site (TSS) of genes (bottom) bound by full length Nup98 or Nup981-504 compared with the indicated DBPs. Adjusted p-values indicating statistical significance of observed overlaps are shown as *** < 0.001 < ** < 0.01 and are indicated above each bar. For panels B and C, see ref.61 for further methodological information.

