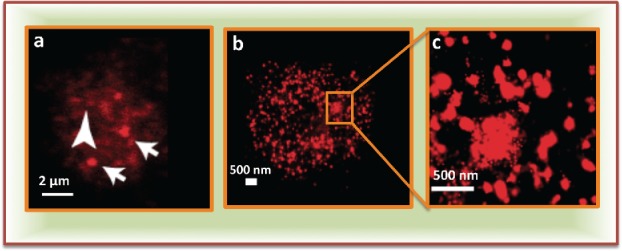
Figure 2.

Subnuclear distribution of proteins: (a) A confocal image showing aggregated (arrows) and diffused (arrow head) fractions of a polycomb protein, polyhomeotic. (b) Super-resolution image showing the distribution of same protein in same cell type. (c) Zoom in from b showing nano-scale subnuclear clusters (modified from Wani et al., 201629).
