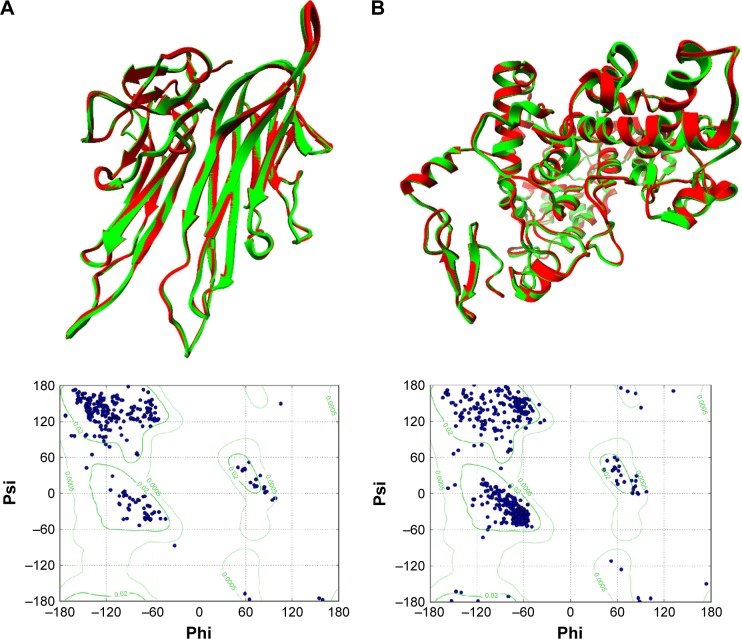
Figure 1.
Three-dimensional structural representations of COX-2 and TNF-α, and Ramachandran plot assessment.
Notes: Structural alignment of homology models (in red) of TNF-α (A) and COX-2 (B) with templates (green) are presented in ribbon representation. Ramachandran plots are shown below for TNF-α and COX-2 in the left and right panels, respectively.
Abbreviations: COX-2, cyclooxygenase-2; TNF-α, tumor necrosis factor alpha.

