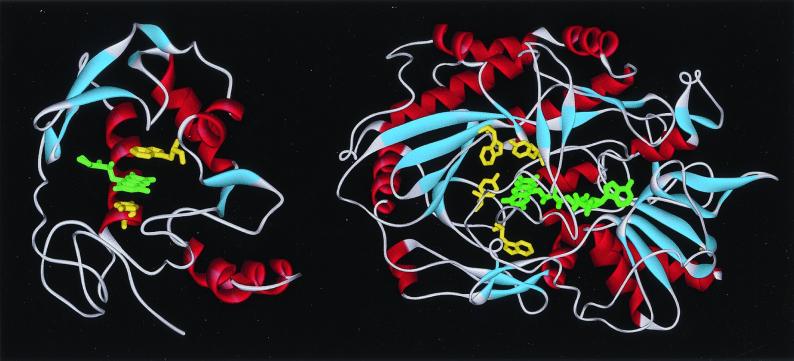
Figure 1.
Ribbon diagram of x-ray structures for RF-binding protein (9) (Left) and GOX (10, 11) (Right). The ligand (RF, green), cofactor (FAD, green), and aromatic amino acid residues (yellow) in the binding sites are shown; Trp-156 (Upper) and Tyr-75 (Lower) in the RfBP structure and Tyr-515, Trp-426, Tyr-68, and Trp-111 (counterclockwise from the top) in GOX. Note that a lid, two white and blue ribbons in the front, covers the cofactor FAD in the binding site.

