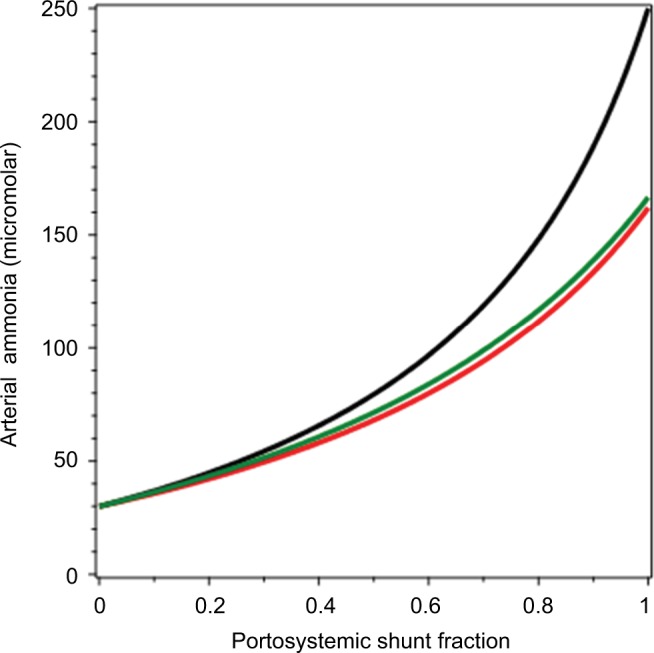
Figure 6.

Arterial NH3 concentration as a function of the fraction of portal blood shunted to systemic veins, bypassing the liver.
Notes: The black line represents rates of NH3 production by the kidney and gastrointestinal tract and utilization by muscle, unchanged from the normal values listed in Table 1. The red line represents muscle NH3 utilization in proportion to arterial NH3, increasing as arterial NH3 increases. The green line represents hepatic artery blood increasing to compensate for decreased portal liver flow, increasing linearly by a factor of 1.5 as the shunt fraction goes from 0 to 1.
