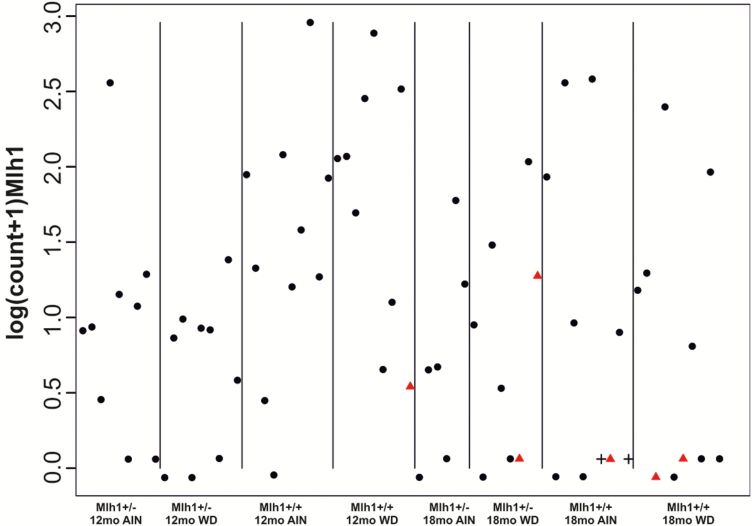
Figure 2.
The Mlh1 mRNA expression in normal mucosa. The Mlh1 gene expression levels detected in individual mice at different time points, genotypes and diet groups, show that five out of six carcinoma mice (red triangle) show very low Mlh1 expression. Non-carcinoma mice E325 and E332 are shown with black crosses.

