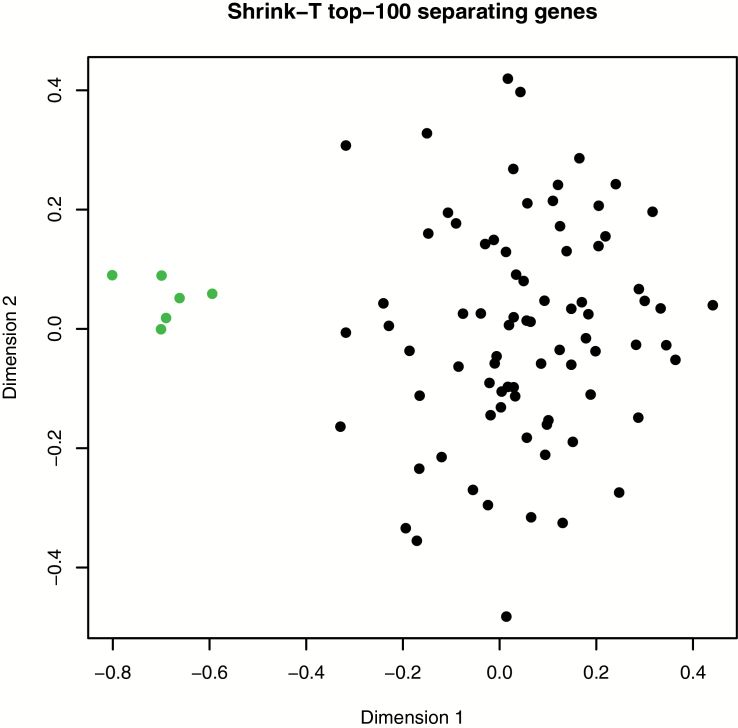
Figure 3.
Genome wide expression profiles in normal colon mucosa. An MDS plot created with the 100 most differentially expressed genes between CRC (green) mice and mice without cancer (black). The expression profiles of the six mice which developed carcinoma up to 18 months of age form a distinct cluster in the plot.

