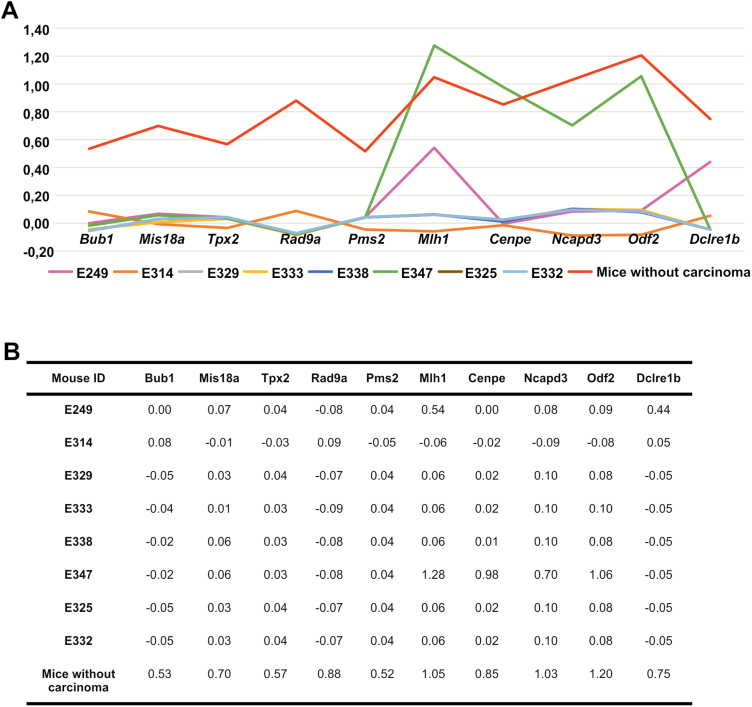
Figure 4.
The expression levels of 10 chromosomal segregation-specific genes in colon mucosa. The mRNA expression levels (gene expression values after ComBat processing) are described as (A) a line chart and as (B) expression values in the carcinoma mice (E249, E314, E329, E333, E338, E347), two mice with similar expression profiles with CRC mice (E325 and E332), and as the average levels of mice without cancer, including mice E325 and E332.

