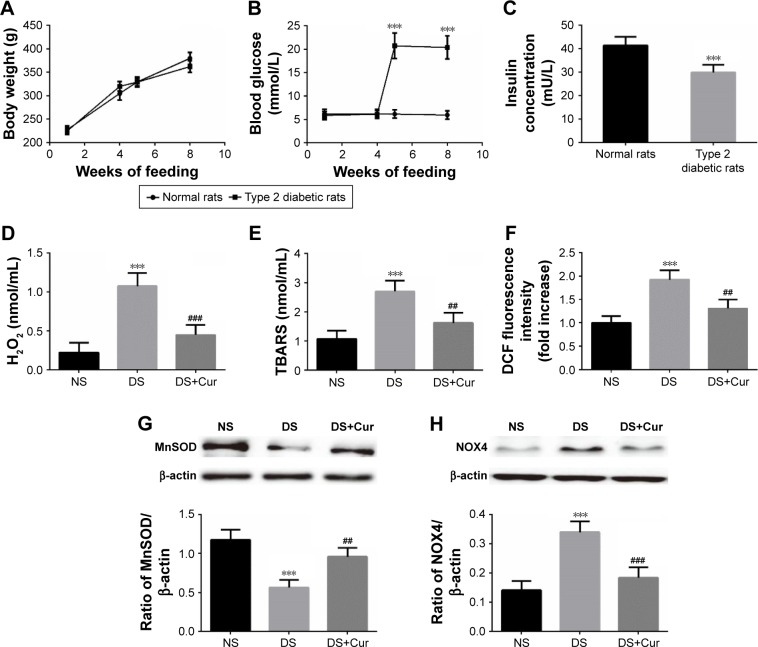
Figure 3.
Changes in (A) body weight, (B) blood glucose, and (C) insulin concentration of the type 2 diabetic group and the normal group during the feeding period. The ROS in the supernatant was determined by measuring (D) H2O2 and (E) TBARS level. (F) The intracellular ROS was evaluated by DCF fluorescence. The mitochondrial status was evaluated by Western blot of (G) MnSOD and (H) NOX4 expression.
Notes: ***P<0.001 vs the normal group (A–C); vs the NS group (D–H). ##P<0.01 vs the DS group; ###P<0.001 vs the DS group.
Abbreviations: ROS, reactive oxygen species; TBARS, thiobarbituric acid reactive substances; DCF, 2′,7′-dichlorofluorescein diacetate; NS, normal serum; DS, diabetic serum; Cur, curcumin.

