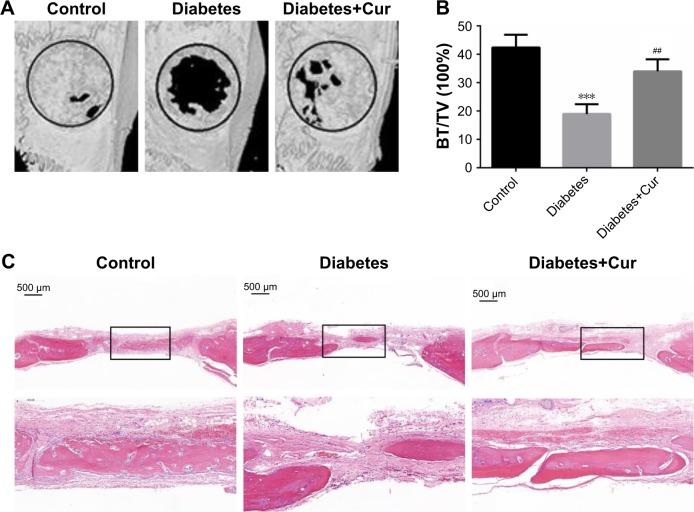
Figure 8.
(A) The 3D reconstruction images of control, diabetes, and diabetes+Cur groups after 8 weeks of implantations (magnification ×5). (B) Bone volume/total volume of different groups at 8 weeks. (C) H&E stained sections of the defect area in different groups at 8 weeks (magnification ×20).
Note: ***P<0.001 vs the control group; ##P<0.01 vs the diabetes group.
Abbreviations: Cur, curcumin; BT/TV, bone volume/total volume.

