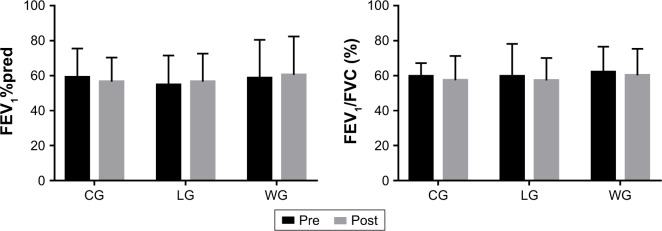
Figure 2.
Pulmonary function before and after the 3-month intervention.
Notes: Data are expressed as mean ± SD. No differences were observed between the groups at baseline and after the intervention. Within-groups comparison was made by the paired-sample t-test.
Abbreviations: %pred, percentage of predicted values; CG, control group; FEV1, forced expiratory volume in the first second; FVC, forced vital capacity; LG, land-based Liuzijue exercise group; post, postintervention; pre, preintervention; WG, water-based Liuzijue exercise group.

