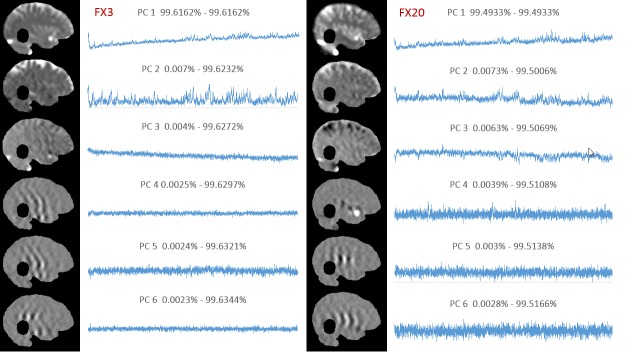
Figure 2. Principal component analysis of treatment fractions 3 and 20.
Principal component analysis on Fraction 3 (left) and Fraction 20 (right). For each fraction, the principal components (PCs) are represented as a function of time; their corresponding weights are visualized as a 2D map on the brain mask. The numbers above the PCs indicate the percentage of total variance explained by the corresponding PC.

