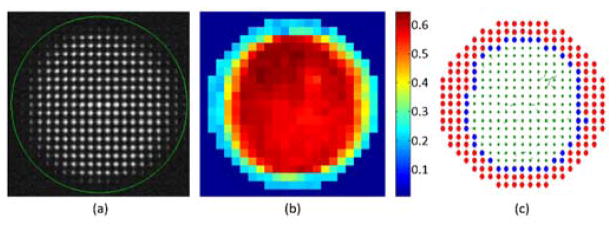
Fig. 1.
(a) CCD image of the Shack Hartmann wavefront sensor. The green circle indicates the area monitored by the Adaptive Optics control algorithm. (b) Metric value of all the spots of the image. (c) Lenslets with metric above 0.5 were accepted (in green), and those with metric below 0.5 (in red) or in the pupil boundary (in blue) were marked for rejection. In the last image the local slope errors for accepted lenslets are drawn as vectors.

