
FIGURE 2.
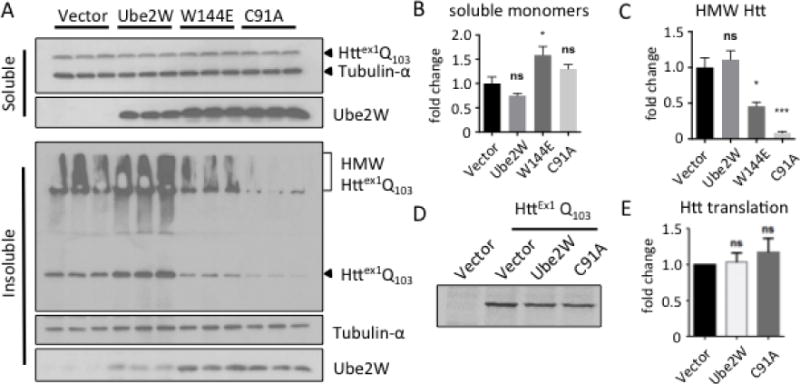
Ube2W alters solubility of Httex1Q103
A. Western Blot of lysates from HEK293 cells transfected with Httex1Q103 and Ube2W or its mutants, Ube2W-W144E or Ube2W-C91A. Upper panel is the TritonX-100 soluble fraction and lower panel is the TritonX-100 insoluble fraction. Immunoblots were performed with anti-GFP (visualizing Httex1Q103), anti-tubulin-α, and anti-Ube2W. (15 μg total protein/lane.) Arrowheads indicate monomeric Httex1Q103, Ube2W or tubulin, and bracket indicates high molecular weight (HMW) Httex1Q103 in stacking gel.
B. Quantification of soluble HTT monomers in upper panel of Fig 2A. Graphs show means +/− SEM; ns, not significant; *, p<0.05. n=3.
C. Quantification of HMW HTT species in lower panel of Fig 2A. Graphs show means +/− SEM; ns, not significant; *, p<0.05; ***, p<0.001. n=3.
D. Autoradiograph of a representative 35S-methionine pulse-chase experiment followed by GFP-IP and gel electrophoresis.
E. Quantification of autoradiograph in Fig 2D. Graphs show means +/− SEM; ns, not significant. n=3.