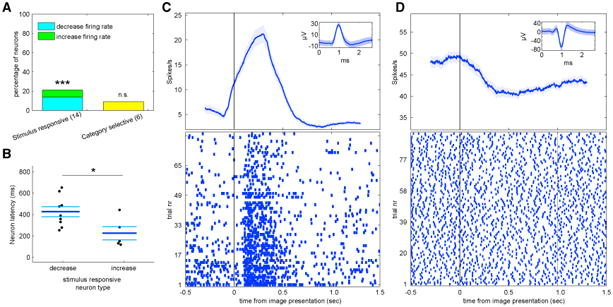
Figure 2. Image-Onset Responsive Neurons in the Human Substantia Nigra.

(A) Percent of all recorded SN cells that responded to image presentation (left) or that were image category selective (right). The numbers below each comparison denote the numbers of neurons classified as each type. We tested whether the observed percentage was higher than that expected by chance by comparing with a null distribution estimated after scrambling the condition labels (repeated 500 times; *p < 0.05, **p < 0.01, and ***p ≤ 0.002).(B) Latency of neurons described in (A). Latency was defined as the first significant bin. Neurons that responded with an increase in firing rate responded significantly faster (p = 0.03). Each dot represents the response of one neuron. The three bars mark, from top to bottom, upper SEM, mean, and lower SEM.
(C and D) Two example cells that responded to image presentation with (C) an increase or (D) decrease in firing rate. Top: poststimulus time histograms (PSTHs) (bin size 400 ms; step size 1 ms). Shaded areas represent± SEM across trials. Image onset was at t = 0. Insets show the mean extracellular waveform ±SEM of all spikes that belong to this cell.
