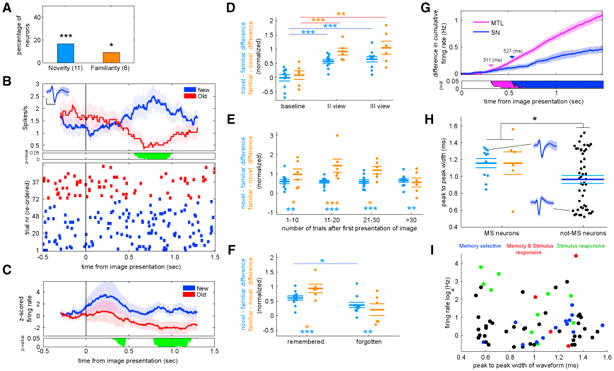
Figure 3. Memory Selective Neurons in the Human Substantia Nigra.

(A) Percent of all recorded SN cells that showed a significant increase in firing rate to novel images (n = 11) or familiar images (n = 6; see also Figure S3).
(B) Example of a memory selective cell. Top: PSTH (bin size, 400 ms; step size,1 ms). Shaded areas represent ± SEM across trials. Middle: periods of significance marked in green (p < 0.05, permuted t test; corrected for multiple comparisons using a cluster-size correction). Bottom: raster plot with trials sorted according to image novelty/familiarity. The inset shows the mean extracellular waveform ± SEM of all spikes associated with this cell. Inset represents waveform of the neuron; vertical and horizontal scale bars mark 20 mV and 1 ms, respectively.
(C) Group PSTH of all units that increased their firing rate to novel images (n = 11). Shaded areas represent ± SEM across neurons. The bottom panel shows periods of significance (p < 0.05, permuted t test; corrected for multiple comparisons using a cluster-size correction; bin size 400 ms, step size 1 ms).
(D–F) Response of MS neurons as a function of the degree of familiarity and behavior. The metric used is the normalized difference in firing rate in response to novel and familiar images (see STAR Methods). Each dot represents one neuron. The three bars mark, from top to bottom, upper SEM, mean, and lower SEM. For (E) and (F), only the first repetition (familiar 1) was used.
(D) Responses differed significantly already the first time an image was repeated (familiar 1), with no further increases for the second repetition (familiar 2).
(E) Effects of number of trials that elapsed between the first (novel) and second (familiar) time an image was shown. The response was significantly different as early as 1–10 trials apart (p < 0.05), with no further significant change (p > 0.05).
(F) The difference in response between the first repetition and when the image was novel was significantly larger for novelty neurons when the patient correctly identified the image as familiar compared to when the patient forgot the image (p < 0.05).
(G) Latency analysis. Shown is the pairwise difference of the cumulative firing rate of all MS neurons in SN and medial temporal lobe between the preferred and non-preferred trial type (novel or familiar). Shaded areas represent ± SEM. The bottom panel shows periods of significance against zero in green (p < 0.05,permuted paired t test; corrected for multiple comparisons using a cluster-size correction).
(H) Comparison of extracellular spike waveform length between MS (left) and non-MS (right) neurons. The two waveforms shown are examples for the indicated data points. The waveform shown on the top is the same neuron that is shown in (B). MS neurons had significantly longer waveforms (t [65] = 2.65; p = 0.012; permuted t test). Each dot represents one neuron. The three bars mark, from top to bottom, upper SEM, mean, and lower SEM.
(I) Scatterplot of firing rate versus waveform with all recorded neurons. Average firing rate is computed during the entire experiment. * indicates p <0.05, ** indicates p < 0.01, and *** indicates p ≤ 0.002 for (A) and p ≤ 0.001 for rest. All pvalues are derived from non-parametric permutation tests (see STAR Methods).
