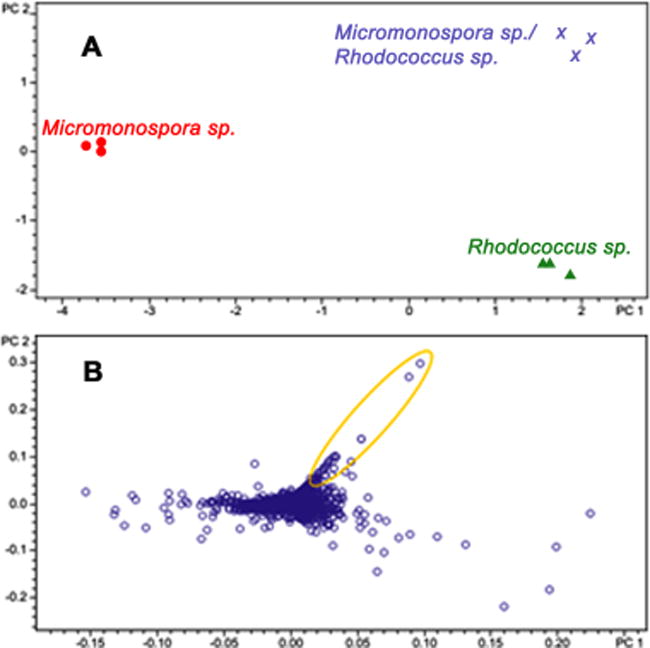
Figure 2.

LCMS-PCA metabolomics of Micromonospora sp. and Rhodococcus sp. co-culture. (A) PCA scores plot describing variance in metabolites in co-culture and monoculture extracts of the Micromonospora sp. and Rhodococcus sp. (B) PCA loadings plot displaying individual metabolites responsible for the variance observed between extracts; the high variance seen in co-culture extracts is attributable to metabolites highlighted by the yellow oval in plot 2B.
