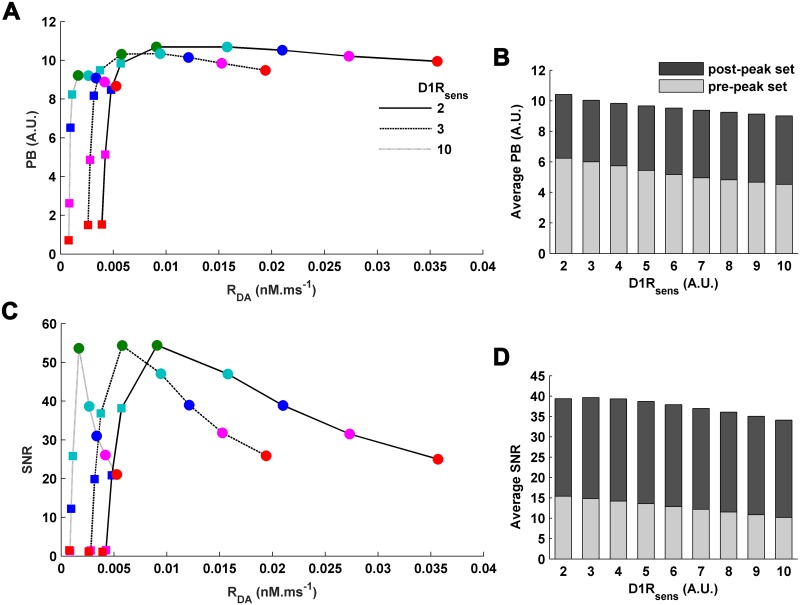
Fig 7. The conserved features of WM-robustness across variation in D1R-sensitivity.
(A) For the different D1Rsens, PB for the sampled levels of sustained pyramidal activities along the aPN-modulation profile always follows a concave profile. The sampled activities from the pre-peak side of the aPN-modulation profile are marked with color-filled squares and that from the post-peak side are shown in color-filled circles. The sampled activities, 90% (cyan), 80% (blue), 70% (magenta), 60%(red), are percentage activities with respect to the peak 100% (green) sustained activity. (B) The average PB of the post-peak set of sustained activities (including the peak activity) in the aPN-modulation profile is always higher than that of the pre-peak set for every D1Rsens. (C) Similarly, SNR for the sampled levels of sustained pyramidal activities always follows a concave profile under different condition of D1Rsens. (D) Moreover, the average SNR of the post-peak set of sustained activities is always higher than that of the pre-peak set for all values of D1Rsens.

