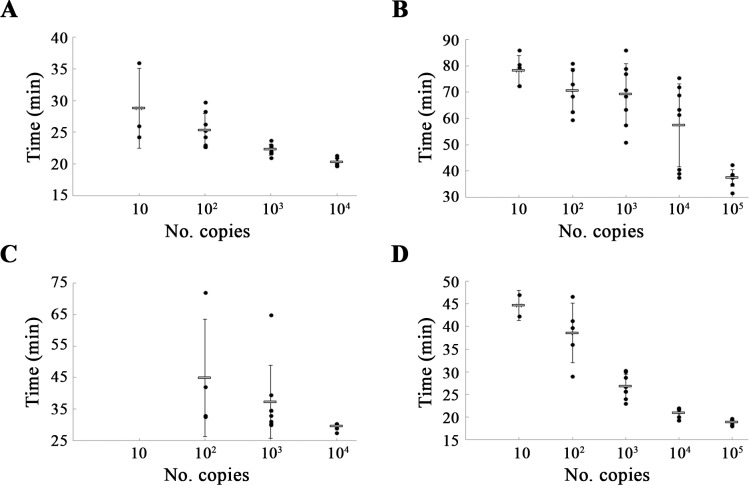
Fig 5. Times (min) of positive detection using serial 10-fold dilutions of DENV RNA.
The mean values are represented with a grey bar and error bars indicate the standard deviation. Black dots refer to positive signals of eight independent runs. (A), (B), (C) and (D) represent the plots referring to DENV1, DENV2, DENV3 and DENV4, respectively.

