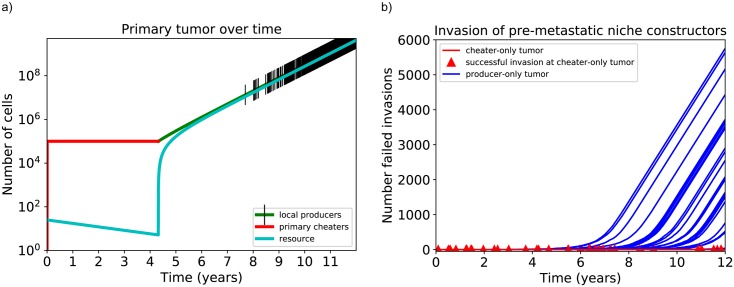
Fig 3. Simulation of tumors starting with cheaters.
Parameters used are r00 = 0.07, r10 = 0.05, r01 = 0.045, r11 = 0.02, k = 105, β0 = 1, β1 = 1.2, θ = ϕ = 0.9, g = 0.004, l = 0.001, α = 10−6, some of which are estimated in S3 Appendix. Mutation rates are mentioned in the text. If successful invasion of producers occurs, cheaters become extinct rather than arrive at coexistence for these parameters. A: Simulation of a single tumor starting with cheaters only and a small amount of resource. Black tick marks represent mutations leading to arrival of secondary or global producers, though none of them lead to successful invasion. B: Simulation of 200 tumors starting with cheaters only. Each red triangle indicates a successful invasion of a cheater-only tumor by secondary or global producers. Each blue curve represents a tumor that has been invaded by local producers; none of these producer-only tumors experienced successful invasion by secondary or global producers despite the arrival of numerous mutants, plotted on the y-axis.

