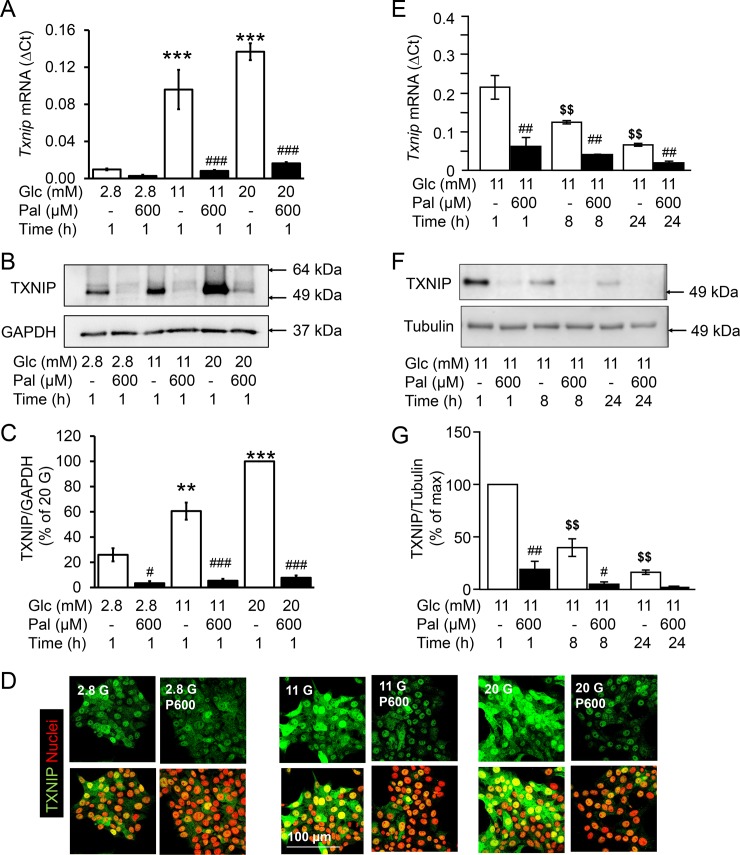
Fig 2. Palmitate- and time-dependent reduction of TXNIP expression despite stimulatory concentrations of glucose.
INS-1E cells were cultured in the presence of test substances as indicated and described under Materials and methods. (A, E) Relative Txnip mRNA levels (ΔCt) to the house keeping gene (Rps13); (B, F) representative western blots; (C, G) quantitative analysis of western blots of three independent experiments presented as mean ± SEM; (D) Representative pictures of immunostained INS-1E cells for TXNIP (green) and nuclei (red). **p<0.01, ***p<0.001 vs 2.8 mM Glc, 1h; #p<0.05, ##p<0.01, ### p<0.001 significant effect of palmitate to the respective Glc concentration at the same time point; $ $p<0.01 significant vs 11 mM Glc, 1h; Abbreviations: Glc, glucose; Pal, palmitate.

