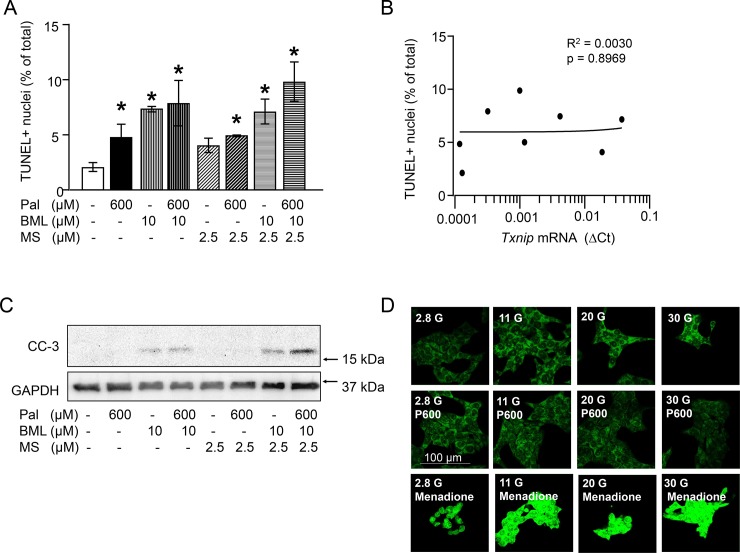
Fig 5. Changes in TXNIP mRNA levels correspond to ROS but not to changes in INS-1E cell death.
(A-C) INS-1E cells were cultured for 24 h in the presence of 11 mM glucose and test substances as indicated and described under Materials and methods. (A) Percentage of TUNEL positive cells, *p<0.05 significant vs control culture, (B) correlation between TUNEL positive nuclei and relative TXNIP mRNA levels (∆Ct), (C) representative western blot for cleaved caspase 3, GAPDH was used as loading control; (D) representative pictures of INS-1E cells stained with the ROS sensor CellROXGreen. INS-1E cells were cultured for 2 h in the presence of different glucose concentrations, palmitate (600 μM) and menadione (100 μM; ROS inducer) as indicated. CellROXGreen (5 μM) was applied for 1 h in culture. Note the increased green fluorescence (increased ROS levels) in the cells exposed to 30 mM Glc or menadione vs 2.8 mM glucose and 30 mM Glc+palmitate. Abbreviations: Pal, P600, palmitate; BML, BML-275 (AMPK inhibitor); CC-3, cleaved caspase-3.

