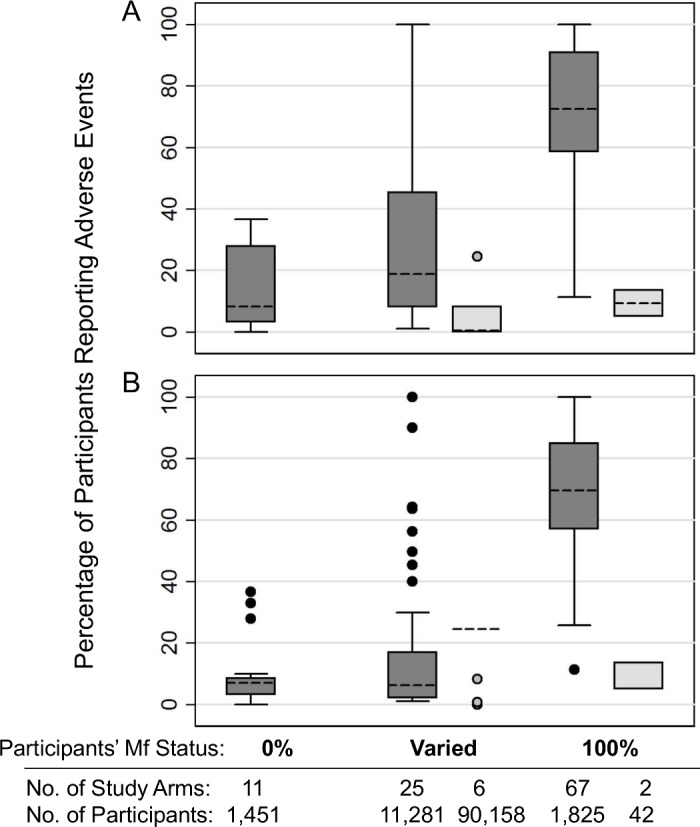
Fig 2. Box plot of reported percentage of participants experiencing at least one AE among individual treatment groups (study arms), comparing active (dark boxes) and passive (light boxes) surveillance methods, excluding placebos.

Groups where no participants (0%) or all participants (100%) were Mf positive were from hospital or clinic-based clinical trials; those with “varied” Mf status were from community studies. A) Results when each study group was considered to have equal weight. B) Results when results were adjusted to consider the number of participants in each study group. Boxes indicate the interquartile range (IQR) and dashed line the median. Whiskers indicate the upper and lower adjacent values: upper = the greatest value less than (75th percentile + (1.5 x IQR)); lower = the lowest value greater than (25th percentile–(1.5 x IQR)).
