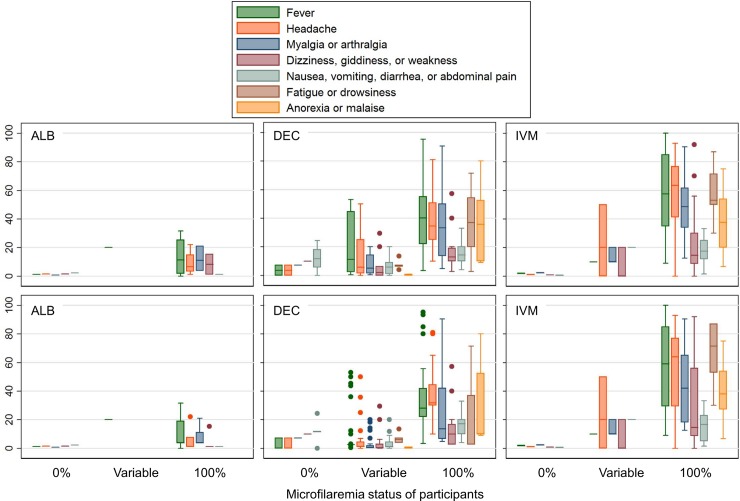
Fig 5. Percentage of participants experiencing common systemic AEs by treatment group, according to the microfilaremia status of participants.
DEC and IVM data include all study arms where the indicated drug was given alone or in combination (with or without ALB). For clarity, the ALB panel shows only study arms in which ALB alone was given. The upper panels assign each study are equal weight; the lower panels are weighted according to number of participants per study arm. Boxes indicate the interquartile range (IQR) and horizontal line the median. Whiskers indicate the upper and lower adjacent values: upper = the greatest value less than (75th percentile + (1.5 x IQR)); lower = the lowest value greater than (25th percentile–(1.5 x IQR)).

