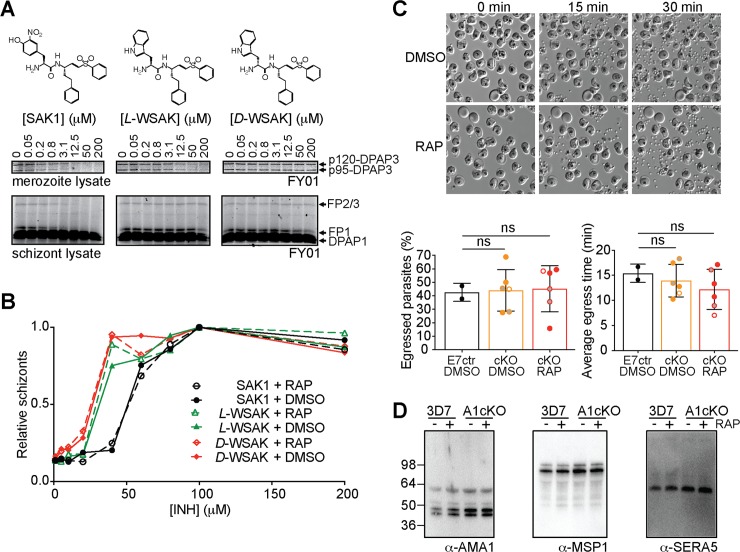
Fig 7. Role of DPAP3 in parasite egress.
(A) L-WSAK is a more selective DPAP3 inhibitor than SAK1. The structures of SAK1, L-WSAK and D-WSAK are shown. Merozoite or schizont lysates were pre-incubated with a dose response of inhibitor for 30 min followed by FY01 labelling. Samples were run on an SDS-PAGE gel, and the gel scanned on a flatbed fluorescence scanner. Bands corresponding to each of the labelled cysteine proteases are indicated by arrows. (B) Effect of inhibitors on egress. DMSO or RAP treated A1cKO parasites were treated at schizont stage with a dose response of inhibitor for 24 h. The accumulation of schizonts upon inhibitor treatment was quantified by FACS. (C) Analysis of egress by video microscopy. C2-arrested schizonts obtained from DMSO- or RAP-treated of A1cKO, F8cKO, F3cKO or E7ctr parasite lines were monitored by time-lapse DIC microscopy for 30 min after C2 washout. Representative still images taken at 0, 15, and 30 min are shown for F8cKO parasites. The full time-lapse video can be seen in S4 Video. The percentage of schizonts that egressed during this 30 min time-lapse (left graph) and the time at which each individual schizont ruptured (right graph) are shown. Bar graphs show mean values ± standard deviation; circles show individual biological replicates (filled for F8cKO, empty for A1cKO, and grey for F3cKO). (D) WB analysis of culture supernatant collected after egress of 3D7 and A1cKO after DMSO or RAP treatment. No differences in the processing of AMA1, MSP1 or SERA5 was observed as a result of DPAP3 truncation.

