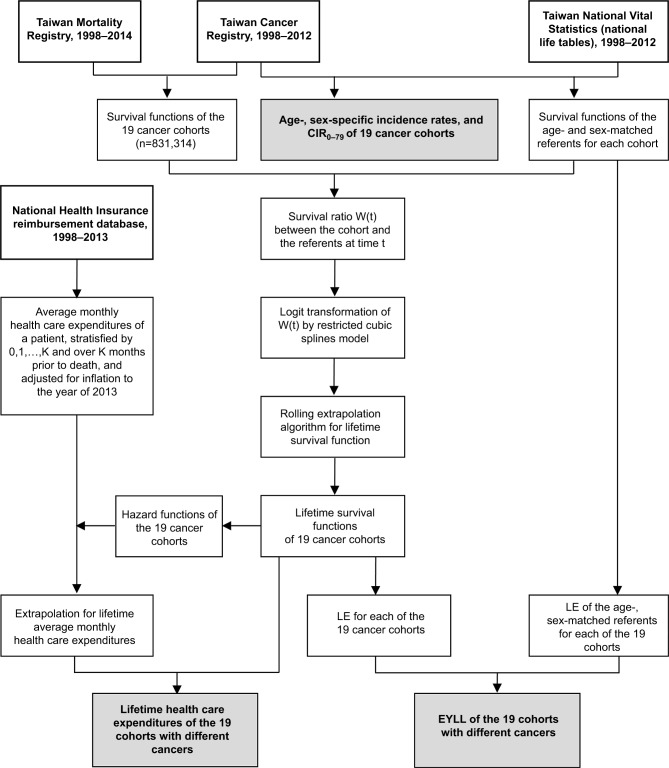
Figure 1.
Flow diagram of the inclusion of subjects and their relevant information for estimations.
Notes: Bold type indicates original datasets, while with shading indicates results.
Abbreviations: CIR0–79, cumulative incidence rate, aged 0–79 years; EYLL, expected years of life lost; LE, life expectancy.

