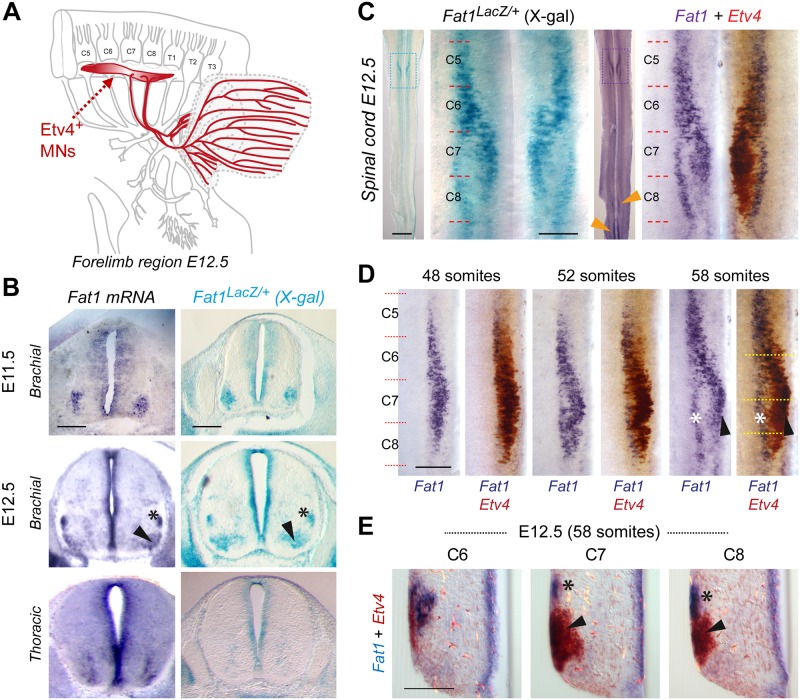
Fig 5. Fat1 is expressed in subsets of brachial MN pools, including CM-innervating Etv4+ MNs.
(A) Scheme representing the brachial region of a mouse embryo at E12.5 with the C4–T2 portion of the spinal cord, the corresponding spinal nerves and their projections to the forelimb, with Etv4+ MNs and their axons highlighted in red, whereas the target muscles CM and LD are delineated in blue (the LD being underneath the CM). (B) Fat1 expression in the mouse brachial spinal cord is shown by in situ hybridization in wild-type embryo sections (left panels) and by X-gal staining on sections of Fat1LacZ/+ spinal cords at E11.5 (top) and E12.5 (bottom), showing expression in all neural progenitors in the ventricular zone and in pools of MNs, visible as one single cluster at E11.5 and two separate pools (arrowhead and asterisk) at E12.5. (C) Fat1 expression in the mouse brachial spinal cord at E12.5 is shown through an X-gal staining of a Fat1LacZ/+ spinal cord (left) or a double in situ hybridization with Fat1 (purple) and Etv4 (brown) RNA probes on a wild-type spinal cord. Fat1 expression is detected in Etv4-expressing MN pools (arrowheads) but also expressed in a distinct dorsal column (asterisk). Spinal cords are flat-mounted, such that the ventral midline is seen as a vertical line in the middle, and motor columns are seen on both sides. For both stainings, the entire spinal cord is shown on the left, and a magnification of the brachial region is shown on the right (corresponding to the delineated zone). Left and right sides of the in situ hybridization panel show a mirror image of the same spinal cord side before and after developing the brown (Etv4) reaction. (D) Double in situ hybridizations with Fat1 (purple) and Etv4 (brown) RNA probes on wild-type spinal cords at three successive time points, 48 somites (E11.5), 52 somites (E12.0), and 58 somites (E12.5), showing the left side of the brachial spinal cord after developing Fat1 only (purple, left) or after developing the second reaction, in brown (right). (E) Cross section on the 58 somite spinal cord shown in (D, right panel) at the three levels indicated by the dotted line in (D), showing the partial overlap (arrowhead) between Fat1 and Etv4 expression and the dorsal pool of MNs expressing Fat1 only. Scale bars, (B) 200 μm; (C) low magnification: 1 mm; (C) high magnification: 200 μm; (D) 200 μm; and (E) 100 μm. CM, cutaneous maximus; C5 to C8, Cervical segments 5 to 8; Etv4, Ets variant gene 4; LD, latissimus dorsi; MN, motor neuron.

