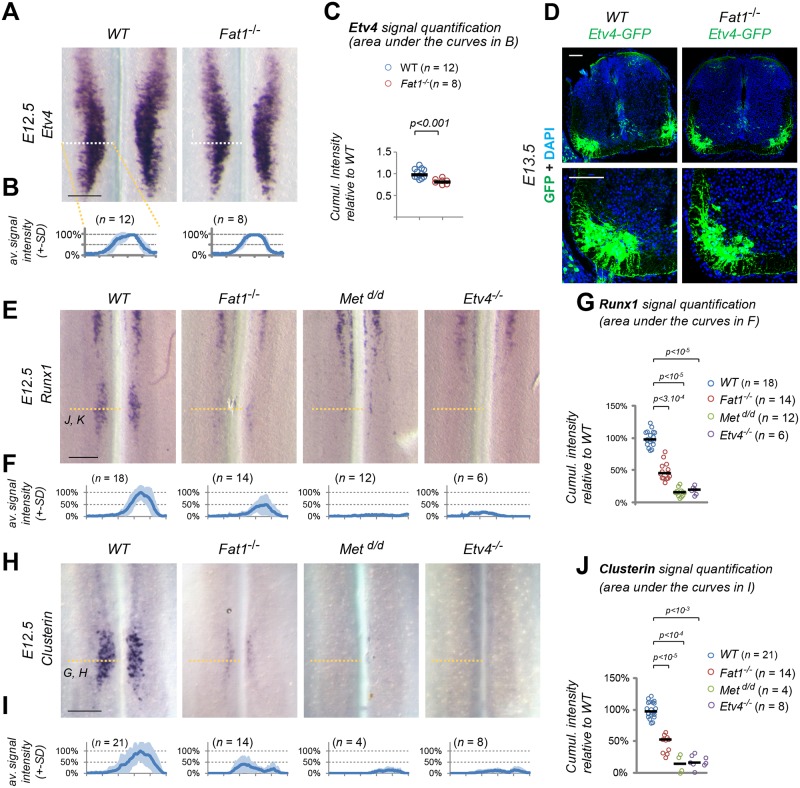
Fig 6. Fat1 knockout alters the specification of CM motor neuron pools.
(A) Etv4 expression was analyzed by in situ hybridization in E12.5 wild-type and Fat1-/- embryos. The images represent flat-mounted spinal cords in the brachial region. (B) Quantifications of Etv4 signal: each plot represents the average signal distribution (± standard deviation in light blue) measured on the indicated number of spinal cord sides along the white dotted line in each image in (A) (Fat1+/+ [n = 12; this set of controls includes the same samples as those shown in S7 Fig]; Fat1-/- [n = 8]). (C) Quantifications and statistical analyses of the sum of signal intensity corresponding to the area under the curves in plots shown in (C): each dot represents the sum of Etv4 intensity for each spinal cord side, the number of samples being indicated (the two sides of each embryo are considered independent). (B–C) Underlying data are provided in S1 Data. (D) Sections of spinal cords from E13.5 Fat1+/+; Etv4-GFP and Fat1-/-; Etv4-GFP embryos (Etv4-GFP transgene, S1 Table) were stained with antibodies against GFP and with DAPI. (E–J) Analysis by ISH of Runx1 (E) and Clusterin (H) expression in flat-mounted brachial spinal cords from E12.5 wild-type, Fat1-/-, Metd/d, and Etv4-/- embryos: expression of Clusterin and Runx1 in the C7–C8 segments is lost in both Etv4 and Met mutants and severely reduced in Fat1-/- spinal cords, whereas the rostral domain of Runx1 expression is independent of Met, Etv4, and Fat1. Quantifications of Runx1 (F, G) and Clusterin (I, J) signal intensity: each plot in (F, I) represents the average signal distribution (± standard deviation in light blue) measured on the indicated number of spinal cord sides along the orange dotted line in each image above (with the corresponding genotype), in (F) for Clusterin and (I) for Runx1. (F, G) Clusterin probe: Fat1+/+ (n = 21); Fat1-/- (n = 14); Metd/d (n = 4); Etv4-/- (n = 8); (I, J) Runx1 probe: Fat1+/+ (n = 18); Fat1-/- (n = 14); Metd/d (n = 12); and Etv4-/- (n = 6). Underlying data are provided in S1 Data. (G, J) Quantifications and statistical analyses of the sum of signal intensity corresponding to the area under the curves in plots shown in (F) and (I), respectively: each dot represents the sum of Runx1 or Clusterin intensity for each spinal cord side, the number of samples being indicated. Underlying data are provided in S1 Data. Scale bars: 200 μm (A, E, H); 100 μm (D). CM, cutaneous maximus; ISH, in situ hybridization; WT, wild-type.

