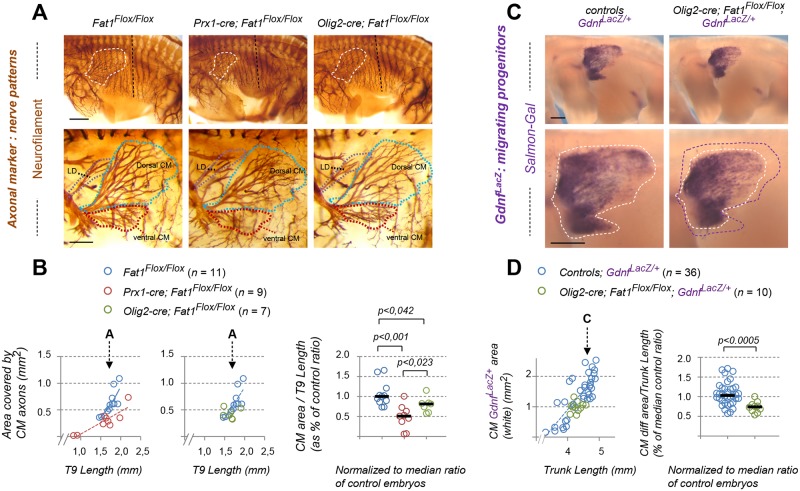
Fig 10. Dual control of CM innervation by Fat1 activity in MNs and mesenchyme.
(A) Anti-neurofilament IHC was performed on E12.5 embryos in the context of Prx1-cre-mediated mesenchyme deletion of Fat1 or of Olig2-cre-mediated Fat1 deletion in MNs (S1 Table). After BB-BA clearing, the embryos were cut in half and the internal organs and skin removed to visualize the CM and brachial plexus. Upper panels show the entire flank of Fat1Flox/Flox (left), Prx1-cre; Fat1Flox/Flox (middle), or Olig2-cre; Fat1Flox/Flox (right) at comparable stages. The area covered by CM-innervating axons is outlined with white dotted lines. Lower panels represent a higher magnification of the flank area containing the CM and corresponding motor axons, after manual removal by dissection of a large part of the thoracic cage and nerves. The shape of the control area corresponding to the dCM and vCM is outlined in green and red dotted lines, respectively. (B) Quantifications of the progression of CM innervation. Left and middle plots: for each embryo side, the area covered by CM-innervating axons was plotted relative to the length of the T9 thoracic nerve, comparing Prx1-cre; Fat1Flox/Flox embryos (red dots) to controls (blue dots) on the left plot, and Olig2-cre; Fat1Flox/Flox embryos (green dots) to the same set of controls (blue dots) on the middle plot. Arrows point to the stage of representative examples shown in (A). Right plot: for each embryo, the CM-innervated area/T9 length was normalized to the median ratio of control embryos, by size range. Blue dots: Controls (n = 11, same sample set in left and middle plot, pooling respective littermates); red dots: Prx1-cre; Fat1Flox/Flox (n = 9); green dots: Olig2-cre; Fat1Flox/Flox (n = 7). Underlying data are provided in S1 Data. (C) Whole-mount β-galactosidase staining was performed using Salmon-Gal as substrate on embryos carrying the GdnfLacZ/+ allele, in the context of MN-specific deletion of Fat1, driven by Olig2-cre at E12.5. Top images: side view of the whole flank. Lower images: higher magnification of the area in which the CM spreads. White dotted lines correspond to the area covered by GdnfLacZ+ progenitors, whereas the purple line on the Olig2-cre; Fat1Flox/Flox image indicates the shape of the control area, to highlight the difference. (D) Quantification of the expansion rate of the area occupied by GdnfLacZ+ progenitors. Left plot: for each embryo side, the area covered by GdnfLacZ+ progenitors was plotted relative to the trunk length. Right plot: for each embryo, the GdnfLacZ+ CM area/trunk length was normalized to the median ratio of control embryos. Blue dots: Fat1Flox/Flox; GdnfLacZ/+ (n = 36; same control set as in Fig 7D); red dots: Olig2-cre; Fat1Flox/Flox-; GdnfLacZ/+ (n = 10). Underlying data are provided in S1 Data. Scale bars: (A) top: 500 μm; (A) bottom: 200 μm; (B) 500 μm. BB-BA, benzyl-benzoate/benzyl-alcohol mix; CM, cutaneous maximus; cre, cre recombinase; dCM, dorsal cutaneous maximus; IHC, immunohistochemistry; MN, motor neuron; Olig2, Oligodendrocyte transcription factor 2; Olig2-cre, cre expression in MN progenitors; Prx1-cre, cre expression in the mesenchyme; vCM, ventral cutaneous maximus.

