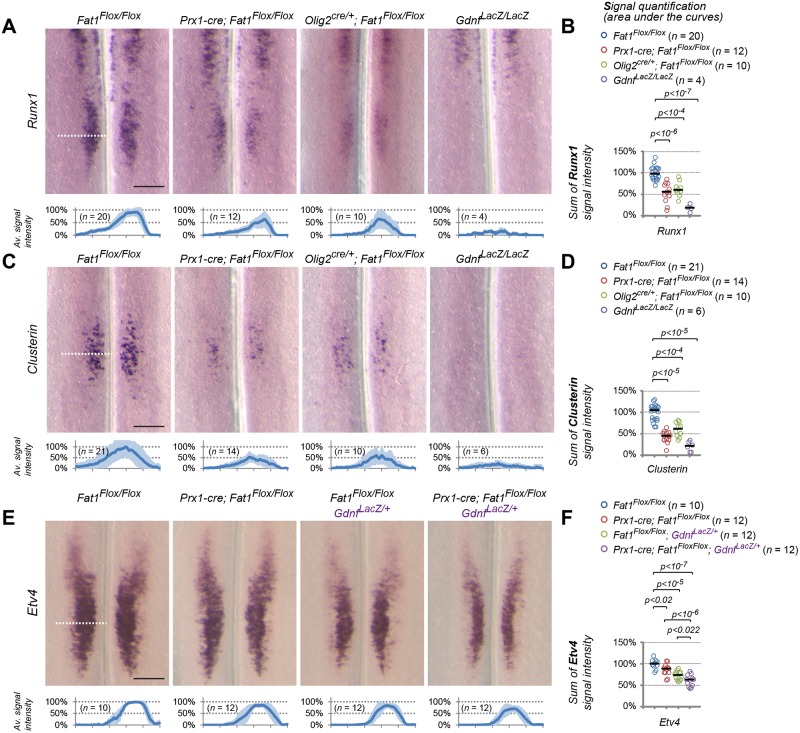
Fig 11. Fat1 is required in both peripheral mesenchyme and motor neurons for proper specification of CM motor pool identity.
(A–B) Analysis of Runx1 (A, B) and Clusterin (C, D) mRNA expression in brachial spinal cords from E12.5 Fat1Flox/Flox, Prx1-cre; Fat1Flox/Flox, Olig2cre/+; Fat1Flox/Flox, and GdnfLacZ/LacZ embryos. Spinal cords are presented as open book and flat-mounted so that the line in the middle of each picture corresponds to the ventral midline, and the motor columns are visible on each side. Fat1 ablation in both the mesenchyme and MNs leads to significant lowering of Clusterin and Runx1 expression levels, whereas expression is absent in the GdnfLacZ/LacZ embryos. Quantifications in (A–D): each plot in (A) and (C) represents, respectively, the average Runx1 and Clusterin signal distribution (± standard deviation in light blue) measured on the indicated number of spinal cord sides along the white dotted line in each image above. Underlying data are provided in S1 Data. (B) The cumulated Runx1 signal intensity (area under the curves in [A]) was plotted for each spinal cord side. Fat1Flox/Flox (n = 20) Prx1-cre; Fat1Flox/Flox (n = 12), Olig2cre/+; Fat1Flox/Flox (n = 10), and GdnfLacZ/LacZ (n = 4). Underlying data are provided in S1 Data. (D) The cumulated Clusterin signal intensity (area under the curves in (C) was plotted for each spinal cord side. Fat1Flox/Flox (n = 21) Prx1-cre; Fat1Flox/Flox (n = 14), Olig2cre/+; Fat1Flox/Flox (n = 10), and GdnfLacZ/LacZ (n = 6). Underlying data are provided in S1 Data. (E) In situ hybridization analysis of the Etv4 expression domain in brachial spinal cord of flat-mounted E12.5 Fat1Flox/Flox, Prx1-cre; Fat1Flox/Flox, Fat1Flox/Flox; GdnfLacZ/+, and Prx1-cre; Fat1Flox/Flox; GdnfLacZ/+ embryos at E12.5. Whereas Fat1 ablation in mesenchyme mildly affects Etv4 expression, genetic lowering of Gdnf levels further prevents Etv4 induction in Prx1-cre; Fat1Flox/Flox; GdnfLacZ/+ embryos, when compared to either Prx1-cre; Fat1Flox/Flox or Fat1Flox/Flox; GdnfLacZ/+. (E, F) Quantifications and statistical analyses of the sum of signal intensity corresponding to the area under the curves in plots shown in (E): each dot represents the sum of intensity for one spinal cord side. Fat1Flox/Flox (n = 10) Prx1-cre; Fat1Flox/Flox (n = 12), Fat1Flox/Flox;GdnfLacZ/+ (n = 12), and Prx1-cre; Fat1Flox/Flox; GdnfLacZ/+ (n = 12). Underlying data are provided in S1 Data. Scale bars: (A, C, E): 200 μm. CM, cutaneous maximus; cre, cre recombinase; Etv4, Ets variant gene 4; MN, motor neuron; Olig2-cre, cre expression in MN progenitors; Prx1-cre, cre expression in the mesenchyme.

