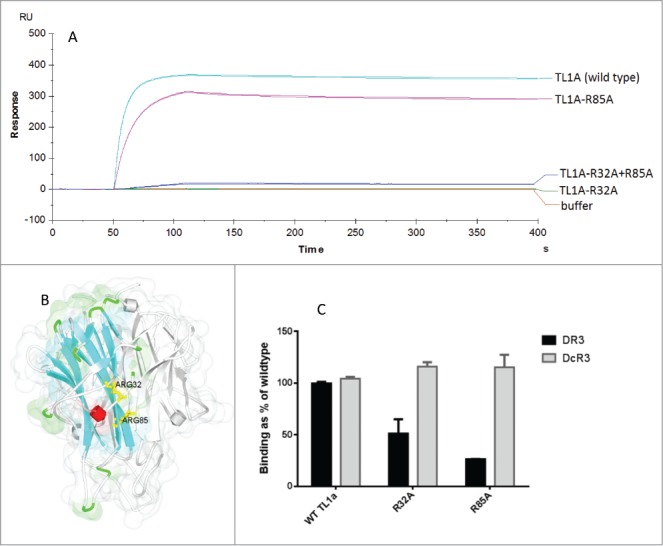
Figure 4.

A) Kinetic analysis of anti-TL1A antibody C03V binding to variants of TL1A measured by SPR (duplicate runs shown) (RU – response units) B) The X-ray crystal structure of TL1A (PDB: 2RE9) showing ARG32 (R32) and ARG85 (R85) in yellow on one of the monomers in TL1A. Ribbon colors indicate secondary structure type, grey indicates other TL1A monomers in the trimeric TL1A structure; C) An ELISA measuring the binding of TL1A, TL1A-R32A and TL1A-R32A to DR3 and DcR3.
