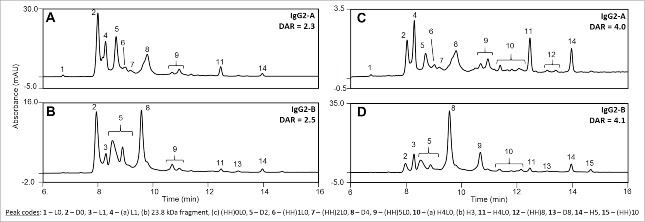
Figure 8.
nrRP-UHPLC chromatograms comparing ADCs with average DAR ∼2.5 (A, B) and average DAR ∼ 4.0 (C, D) conjugated from IgG2-A (A, C) and IgG2-B (B, D). Peak codes listed in the figure were identified by matching observed molecular weights (MW) by LC-MS to the calculated MW of the expected component species.

