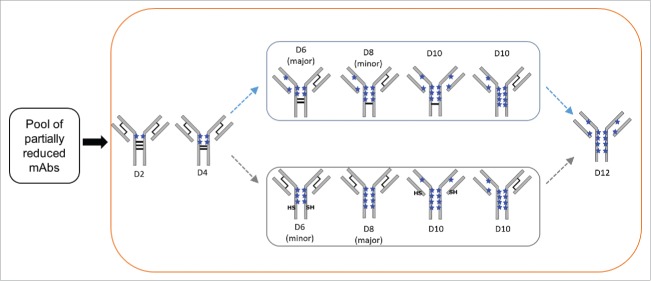
Figure 9.
Main conjugation positional isomers detected IgG2 ADCs via nrRP-UHPLC analysis. Two possible pathways for the formation of D6 to D10 species are shown. Only the IgG2-A isoform is depicted for clarity, where the black lines indicate disulfide bonds and the blue stars represent drug-linkers attached at cysteines. The “SH” labels indicate reduced interchain cysteines that are not conjugated.

