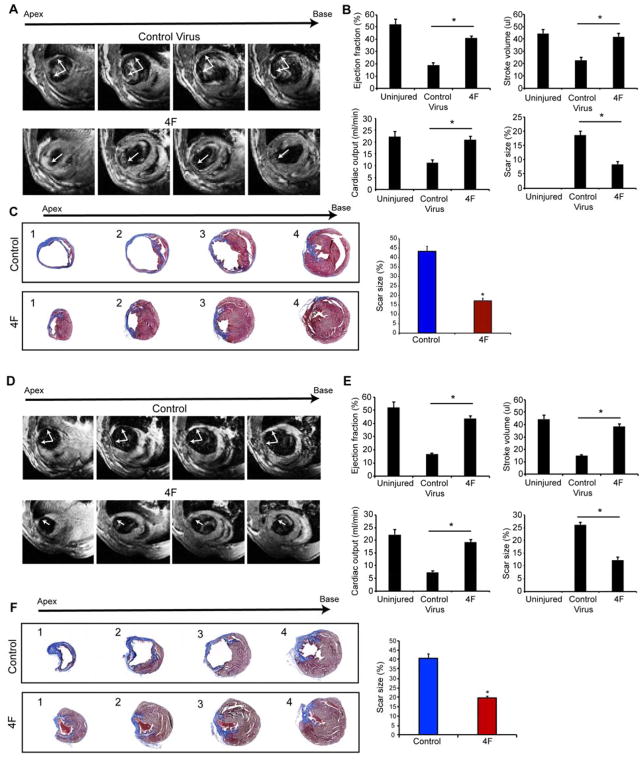
Figure 5. CDK1:CCNB:CDK4:CCND (4F) Expression Enhances Cardiac Function in Mice after Acute or Sub-Acute Myocardial Infarction.
(A) Representative transverse magnetic resonance images (MRI) 12 weeks after myocardial infarction and adenovirus injection at the time of the infarction shows ventricular wall thinning at the infarct site in the control group with improvement in animals that received the 4F (arrows). Multiple images from the bottom (apex) to the top of the ventricular chambers (base) are shown.
(B) Ejection fraction, stroke volume, cardiac output and scar size (through all heart slices), as measured by blinded MRI, were significantly improved in 4F-treated mice, compared to control mice (n=9, *p<0.05).
(C) Representative histological sections through multiple levels of the heart (apex (1) towards base (4)) with Masson’s Trichrome staining showing the scar tissue in blue and the healthy myocardium in red, with and without 4F treatment. Bar graph shows the quantification of scar size by histology (through levels 1–4 as described in the methods) (n=9, *p<0.05). Bars indicate means and error bars indicate SEM. Student t-Test was used to compare between the two groups.
(D) Representative MRI images 12 weeks after myocardial infarction and virus injection 1 week after infarction shows the wall thinning at the infarct site in the control group, which was improved in the animals that received the 4F.
(E) Ejection fraction, stroke volume, cardiac output and scar size as measured by MRI, were significantly improved in 4F-treated mice compared to control mice (n=9, *p<0.05). Bars indicate means with SEM.
(F) Representative histological sections through multiple levels of the heart with Masson’s Trichrome staining, with and without 4F treatment delivered one week after injury. Bar graph shows the quantification of scar size by histology (n=9, *p<0.05). Also, see Figure S7.

