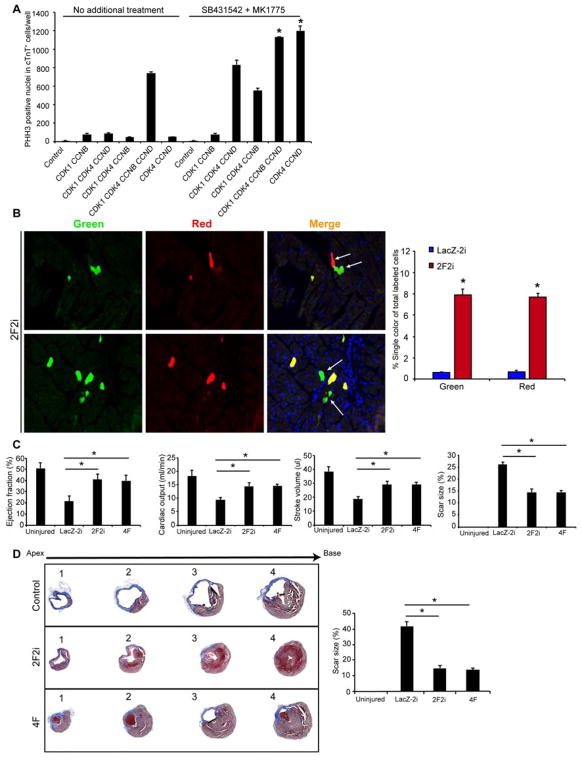
Figure 6. CDK4 and CCND, with Transient Wee1 and TGFβ Inhibition (2F2i), Induces Cardiomyocyte Proliferation and Enhances Cardiac Function after Injury.
(A) Histograms quantifying the number of PHH3+ nuclei in cTnT+ human iPS-CMs upon expression of indicated combinations of factors in the presence or absence of a Wee1 inhibitor (MK1775) and a TGFβ inhibitor (SB431542) (*p<0.05).
(B) Representative immunofluorescence images and quantification of single colored (red or green) cells in histologic sections of α-MHC MER-CRE-MER MADM mice, indicating cardiomyocytes that underwent cytokinesis (n=4 animals in each group *p<0.05).
(C) Ejection fraction, stroke volume, cardiac output and scar size (through all ventricular heart slices), as measured by blinded MRI after 3 months, were similarly improved in 2F2i and 4F-treated mice compared to control mice (n=8, *p<0.05).
(D) Representative histological sections through multiple levels of the heart (apex [1] towards base [4]) with Masson’s Trichrome staining showing the scar tissue in blue and the healthy myocardium in red, with LacZ-2i, 2F2i, or 4F treatment. Bar graph shows quantification of scar size by histology (through levels 1–4 as described in the methods) (n=8, *p<0.05). Bars represent means and error bars indicate SEM. One-way ANOVA was used to compare between the three groups.

