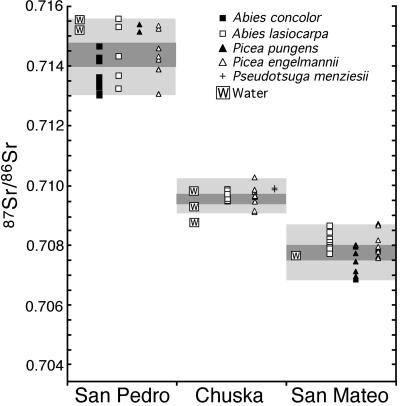
Figure 2.
87Sr/86Sr ratios of live trees and local waters from sampled sites. Dark shading represents the mean 87Sr/86Sr ratio (95% confidence interval) of live wood samples analyzed without regard to species. Light shading represents full range of modern wood 87Sr/86Sr ratios from each area. Analytical errors are smaller than symbols shown.

