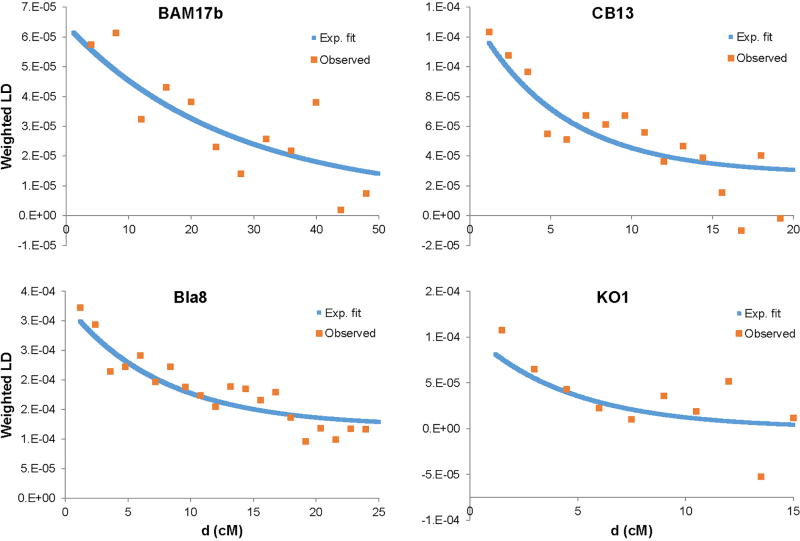
Extended Data Figure 3. Examples of ALDER weighted LD decay curves.
Weighted LD is shown as a function of genetic distance d, using Neolithic Anatolians and WHG as references, for four individuals: BAM17b (Starčevo EN), CB13 (Iberia EN), Bla8 (Blätterhöhle hunter-gatherer), and KO1. The results shown here use helper individuals M11–363 (Neolithic Anatolian), L11–322 (Neolithic Anatolian), BIC, and LB1, respectively, and have fitted dates (blue curves) of 3.8±1.2, 18.3±6.0, 13.1±2.7, and 21.6±8.8 generations (compared to final individual-level dates of 4.5±1.9, 17.5±3.5, 12.1±2.9, and 21.0±7.0 generations; see Supplementary Information section 7). Note different x-axis scales for the four individuals.

