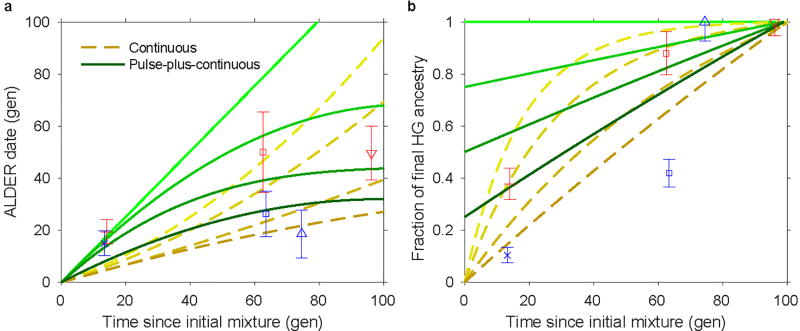
Extended Data Figure 5. Germany and Iberia time series and simulated data.
a, Dates of admixture. b, Hunter-gatherer ancestry proportions, normalized by the total in the most recent (rightmost) population. Symbols are as in Figs 1 and 2, here showing population-level averages plus or minus two standard errors. Yellow dashed lines represent continuous admixture simulations: from top to bottom, diminishing 5% per generation, diminishing 3%, diminishing 1%, and uniform. Green solid lines represent pulse-plus-continuous admixture simulations: from top to bottom, all hunter-gatherer ancestry in a pulse at time zero; 3/4 of final hunter-gatherer ancestry in an initial pulse, followed by uniform continuous gene flow; half in initial pulse and half continuous; and 1/4 in initial pulse.

