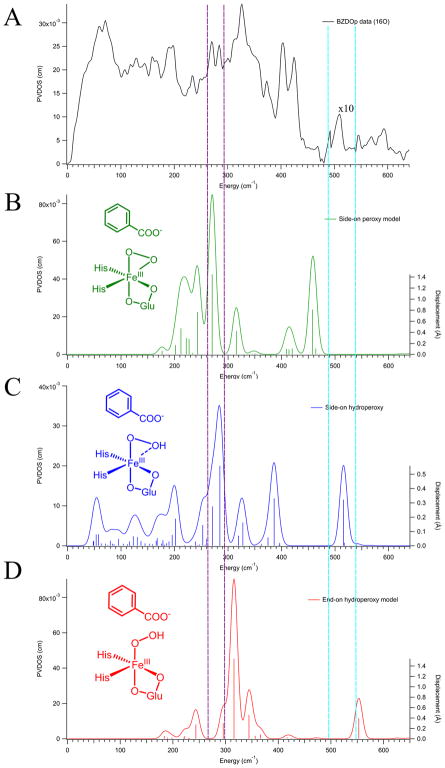
Figure 2.
NRVS spectrum of BZDOp (A) compared with three DFT-simulated spectra of possible structures: side-on peroxy (B, green), side-on hydroperoxy (C, blue), and end-on hydroperoxy (D, red). Intensity in the region between 480 and 540 cm−1 (between the cyan lines) has been multiplied by 10 in the BZDOp (A) data to show the Fe–O stretch on the same scale as the rest of the NRVS spectrum. The intensities in the simulations have not been adjusted. The right axis of the simulations depicts the calculated amount of Fe displacement in each normal mode, represented by the vertical sticks, in Å. Regions where BZDOp has features distinct from the Rieske center, and BZDOOX are highlighted between purple and cyan vertical dotted lines. Schematic depictions of the DFT structures are included as insets.

