
Figure 3.
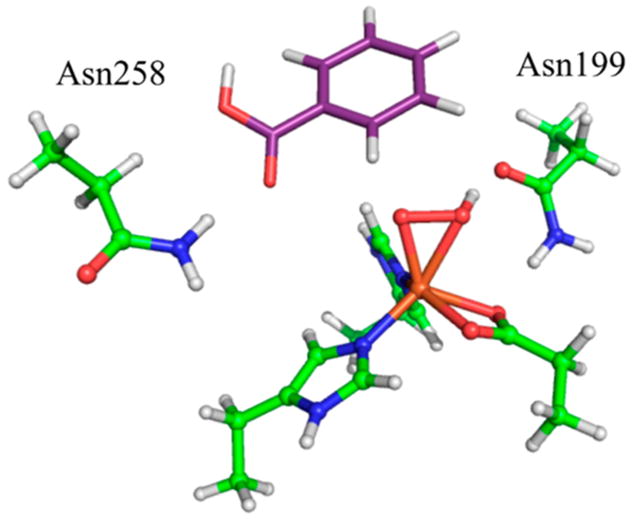
DFT-optimized structure of BZDOp that is consistent with the NRVS data. Protein carbons are shown in green, benzoate carbons in purple, nitrogens in blue, oxygens in red, hydrogens in white, and iron in orange.
Official websites use .gov
A
.gov website belongs to an official
government organization in the United States.
Secure .gov websites use HTTPS
A lock (
) or https:// means you've safely
connected to the .gov website. Share sensitive
information only on official, secure websites.
DFT-optimized structure of BZDOp that is consistent with the NRVS data. Protein carbons are shown in green, benzoate carbons in purple, nitrogens in blue, oxygens in red, hydrogens in white, and iron in orange.