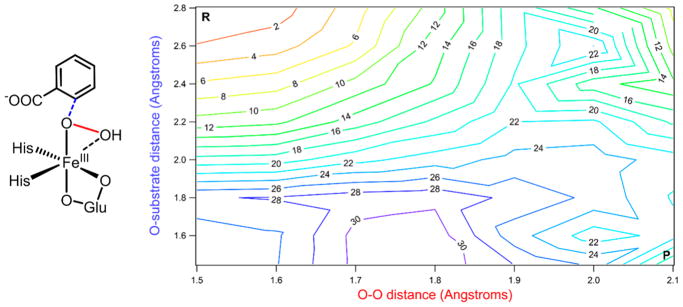
Figure 4.
Left: Schematic of BZDOp with the O-substrate (carbon 2) coordinate shown in blue and the O–O coordinate shown in red. Right: 2D potential energy surface for BZDOp reacting with substrate, with O–O elongation on the x-axis and O-substrate contraction on the y-axis. The starting point of the surface is at the upper-left corner marked by an R, and the ending point is at the lower-right and marked by a P. Electronic energies are given on the contours in 2 kcal/mol increments, with colors closer to the blue end of the spectrum corresponding to higher energies.

