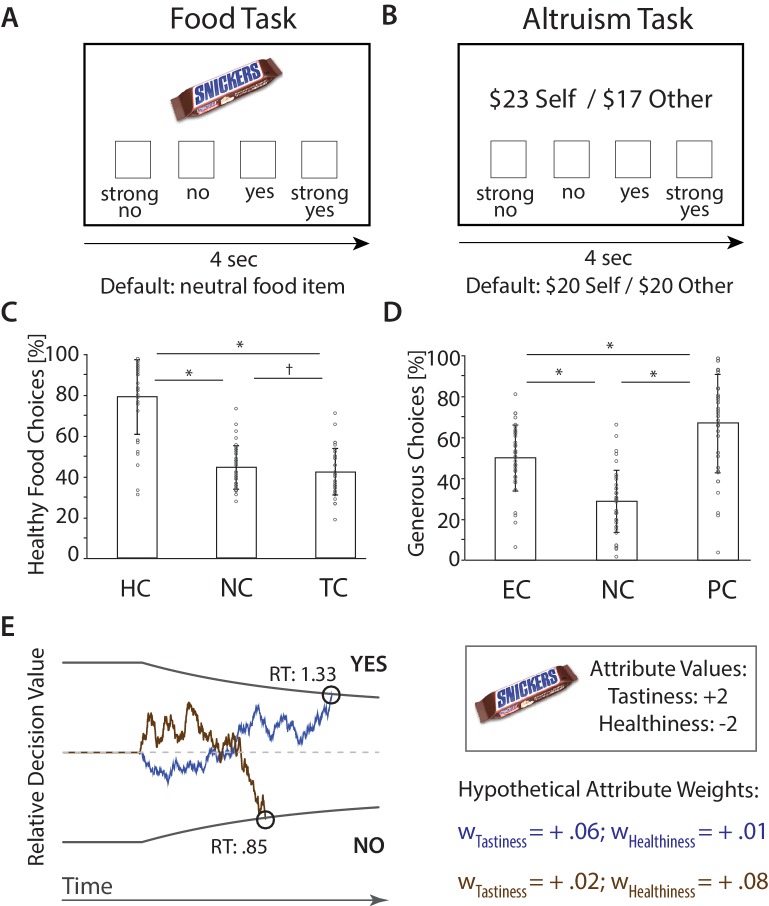
Figure 1. fMRI Paradigms and Choices.
(A) Food Task. Subjects chose between on-screen food items that varied in tastiness and healthiness and a neutral default food. Choices were made in ‘Natural’ [NC], ‘Focus on Health’ [HC], and ‘Focus on Taste’ Conditions [TC]. (B) Altruism Task. Subjects chose between on-screen proposals that affected the payoff of themselves ($Self) and an anonymous partner ($Other) and a default option ($20 for both). Choices were made in ‘Natural’ [NC], ‘Focus on Ethics’ [EC], and ‘Focus on Partner’ Conditions [PC]. (C) (D). Bar plots illustrate condition-wise percentages of healthy (C) and generous (D) choices (M ± SD), and subject-specific scores (circles). *p < 0.05, corrected, †p < 0.05, uncorrected. (E) Computational behavioral model (DDM). Choices (yes/no) are made when the sequential accumulation of noisy value information that unfolds over time crosses the predefined upper or lower threshold for choice. The relative decision value (RDV) at a point in time (t) is computed as the weighted sum of choice relevant attributes plus noise (ε) (i.e., RDVt = RDVt-1 + wTastiness * Tastiness + wHealthiness * Healthiness + εt). In the example displayed here, the value of a candy bar will tend to accumulate in a positive direction if the weight on Tastiness is high (blue line), yielding a choice in favor of a tasty but unhealthy item. However, the value of the food item is more likely to accumulate in a negative direction if the weight on Healthiness is high (brown line). Note that saying Yes can sometimes indicate a healthy choice, and sometimes an unhealthy choice. (RT = reaction times [sec]; figure adapted from [Hutcherson et al., 2015b; Adolphs and Tusche, 2017]).
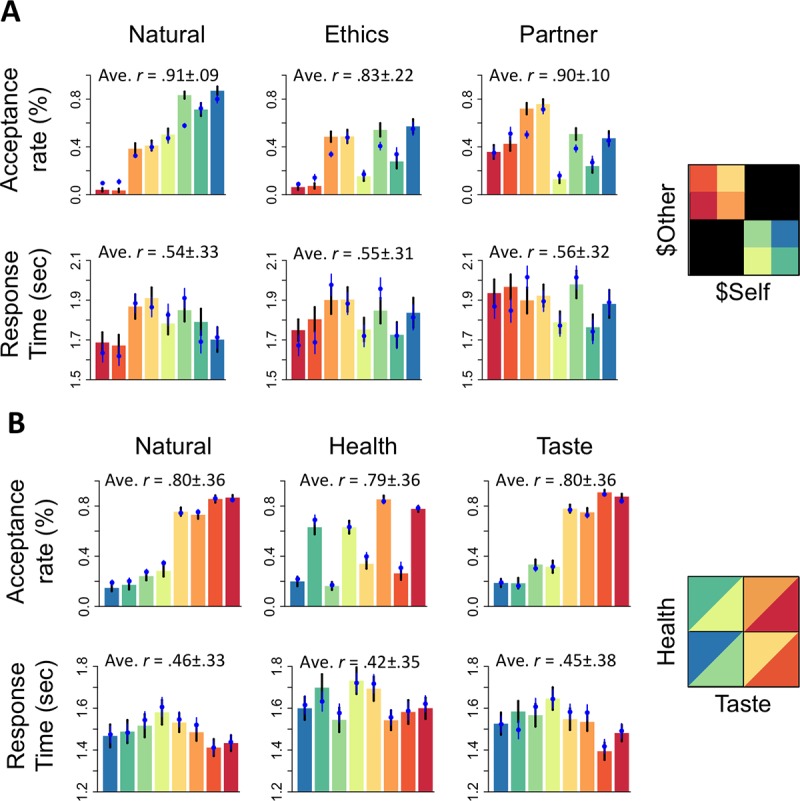
Figure 1—figure supplement 1. Drift diffusion model (DDM) fits to behavior in both choice tasks.


