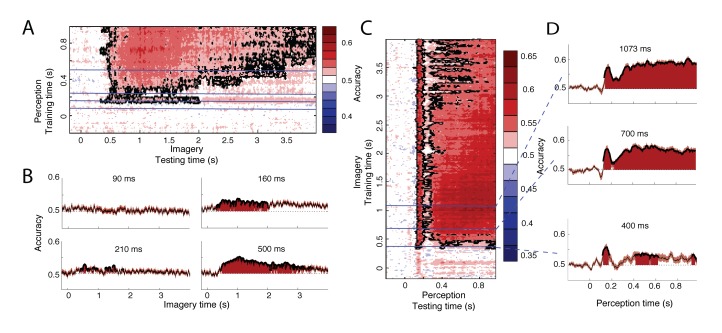
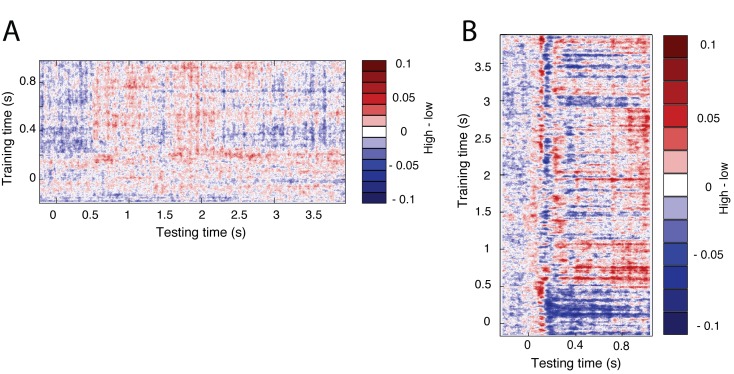
Figure 3. Generalization between perception and imagery over time.
(A) Decoding accuracy from classifiers trained on perception and tested during imagery. The training time during perception is shown on the vertical axis and the testing time during imagery is shown on the horizontal axis. (B) Decoding accuracies for classifiers trained on the four stages during perception. (C) Decoding accuracy from classifiers trained on imagery and tested during perception. The training time during imagery is shown on the vertical axis and the testing time during perception is shown on the horizontal axis. (D) Decoding accuracies for different training times during imagery. Source data for the analyses reported here are available in Figure 3—source data 1.


