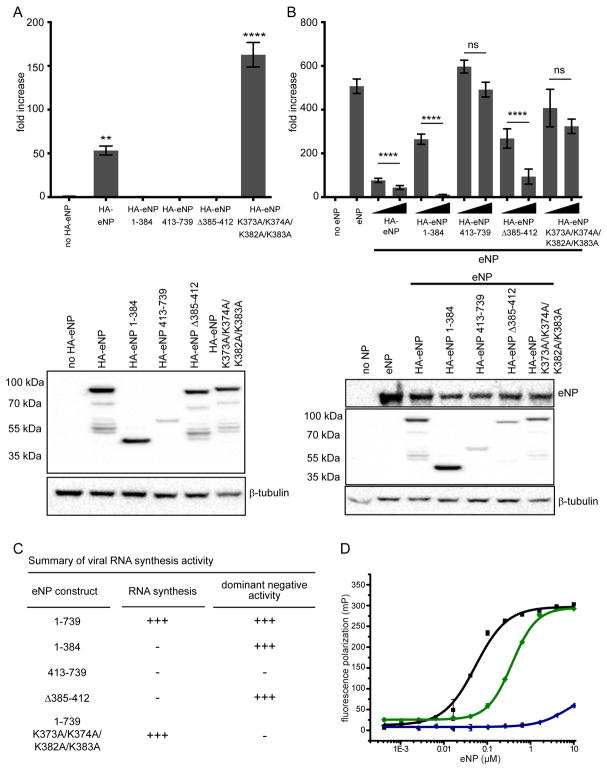
Figure 4. The C-terminal helix α23 is a CDRM that regulates eNP viral RNA synthesis.
(A) A minigenome assay was performed to compare the activities of wild-type eNP or eNP mutants 1–384, 413–739, eNP Δ385–412, and eNP K373A/K374A/K382A/K383A (N-terminus tagged constructs) on EBOV RNA synthesis. (B) The minigenome assay was conducted with eNP +/− HA-eNP wildtype or mutants 1–384, 413–739, eNP Δ385–412, and eNP K373A/K374A/K382A/K383A (N-terminus tagged constructs) to test the dominant negative effect of these proteins on EBOV RNA synthesis. Two concentrations of HA-eNP proteins, 25 ng and 250 ng, were used and the expression was assessed by Western blotting using anti-HA antibody and untagged eNP was assessed by using anti-NP antibody. The luciferase activity was determined 48 h post transfection. The fold increase was determined by normalizing Renilla to firefly luciferase values and setting the value of the “no eNP control” to 1. Statistically significant differences were determined using one-way ANOVA, followed by tukey’s test. *p < 0.001, **** < 0.0001. The error bars denote the standard deviation of three replicates. (C) The summary of RNA synthesis activity and dominant negative activity against wt NP is shown. (D) Fluorescence polarization binding curves of eNP proteins for 20 nt ssRNA. The measured KD values are 0.068 ± 0.020 μM (eNP-2, ■), 0.283 ± 0.129 μM (eNP-5,
 ), and >10 μM (eNP-6,
 ). Each measurement was performed at least twice independently in duplicate.

