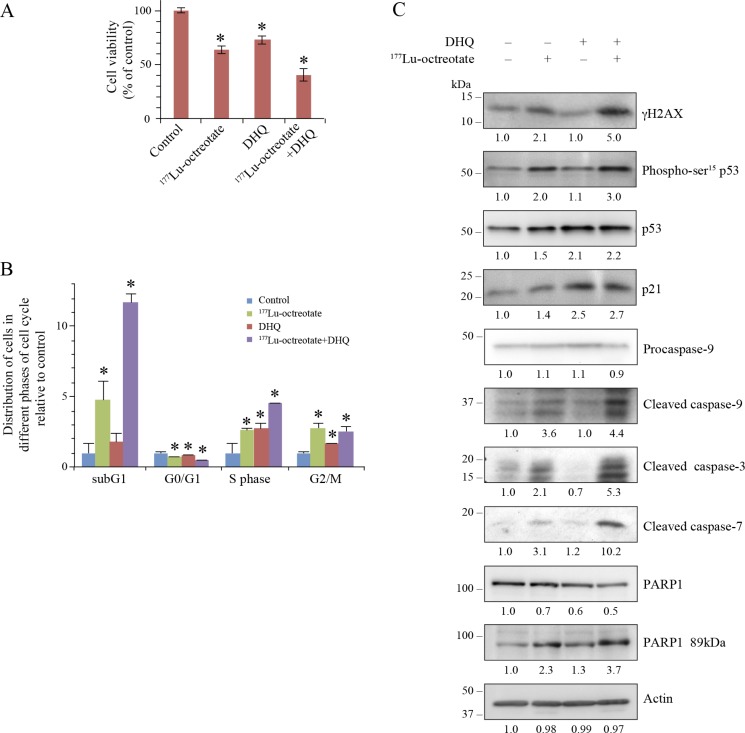
Figure 2. Effect of 177Lu-octreotate and PARPi on BON-1 cell monolayers.
(A) PARPi augments the 177Lu-octreotate-induced reduction in cell viability. The cells were treated in six replicates for five days with 177Lu-octreotate and DHQ independently and in combination followed by 10 more days of incubation of cells in medium without radiolabel and viable cell count was taken on the 10th day. The cell count is expressed as percent of viable cell count as compared to the untreated control. The number of cells seeded at the start of the experiment was 3.82% of the number of control cells on day of harvest. The average of six replicates per experimental condition are plotted as mean ± SEM and * indicates a significant difference from % viability of control cells. (B) PARPi potentiates 177Lu-octreotate-induced cell death and cell cycle arrest in BON-1 cells. The cells treated as above for panel-A were harvested at day 10 and analyzed by flow-cytometry after staining with propidium iodide. The data of each cell cycle phase (sub-G1, G1, S, and G2/M) is derived from triplicates per experimental condition and are plotted as mean ± SD of the fold change of the cell population relative to that of control of same phase of the cell cycle in the untreated controls and * indicates a significant difference from control cells in the given phase of cell cycle. (C) PARPi increases the downstream effects of 177Lu-octreotate–induced DNA damage on cell cycle arrest and apoptosis. The cells were treated in six replicates as indicated for panel A, harvested and pooled together for immunoblotting of parameters of DNA damage (γH2AX and phospho-p53), cell cycle arrest (p53 and p21) and apoptosis (Cleaved caspase 9, 3, 7 and PARP1 89kDa). Their band densities in arbitrary units were measured using GeneTools analysis software (Syngene) and normalized with the band density of actin from the corresponding samples. The fold change in the normalized band density of each protein in each treatment groups relative to control is indicated below each immunoblot. The panel for each immunoblot represents one of the two independent identical experiments with similar results.

