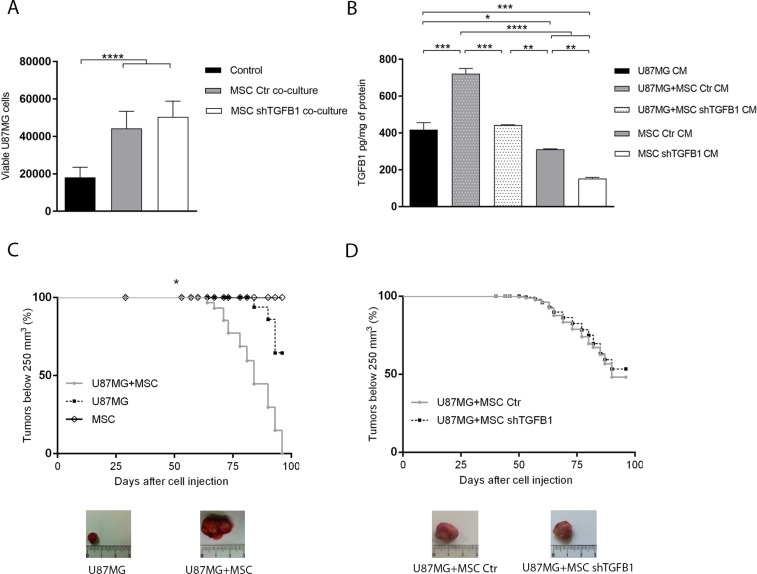
Figure 2. Effects of MSC on GBM cell tumorigenicity.
(A) Total amount of viable U87MG cells in single cultures or co-cultures with MSC allowing direct cell-cell contact. (B) TGFB1 protein levels in CM from U87MG and MSC single cultures, and in CM from U87MG–MSC co-cultures systems. (C) Kaplan–Meier plots of tumor growth after subcutaneous injection of MSC, U87MG cells, or U87MG cells in combination with MSC, in nude mice. Representative tumor images are shown. MSC injection did not generate tumors. (D) Kaplan–Meier plots of tumor growth after subcutaneous injection of U87MG cells with transduced MSC in nude mice. Representative tumor images are shown. MSC Ctr. (MSC transduced with non-specific control plasmid); MSC shTGFB1 (MSC transduced with TGFB1 shRNA plasmid). Significance: *p ≤ 0.05, **p ≤ 0.01, ***p ≤ 0.001, ****p ≤ 0.0001.

