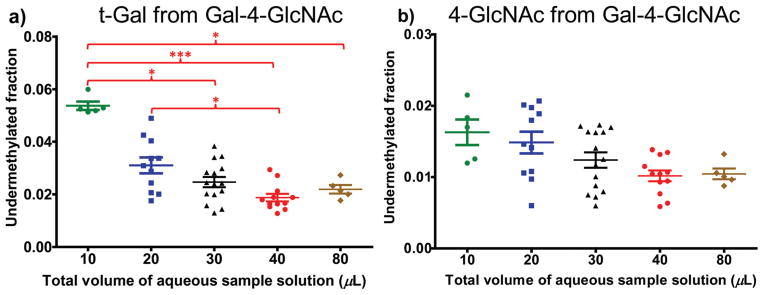
Fig. 3.
Effect of original-aqueous-sample volume on permethylation efficiency: (a) univariate distribution of the undermethylated fraction of t-Gal, (b) univariate distribution of the undermethylated fraction of 4-GlcNAc. N = 6 to 15 for each volume. Undermethylated fractions were determined as described in the Methods section. Kruskal–Wallis followed by Dunn’s post hoc tests demonstrated significant differences in the degree of under-methylation at the tested volumes of water in the original samples. Error bars indicate mean ± standard error of the mean (SEM). Single asterisk (*) indicates significant differences between groups with p ≤ 0.05. Three asterisks (***) indicate significant differences between groups with p ≤ 0.001.

