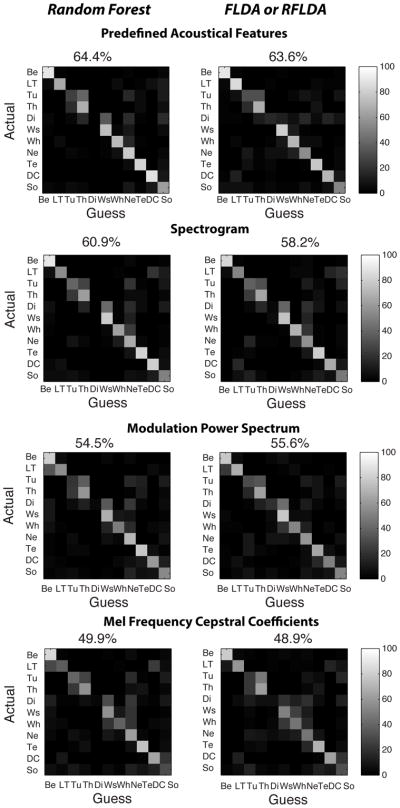
Figure 10. Confusion Matrices.
The figure shows all the confusion matrices obtained from the Random Forest (left column) and Regularized Fisher Linear Discriminant Analysis (right column) for the four feature spaces used here and described on Figures 1, 2, Supplementary Figures 1 and 2. In a confusion matrix each row shows how exemplars from a particular vocalization category were classified into the categories shown in the columns. The color code is used to show the probability of that classification: the conditional probability of classifying a vocalization as type x (column x) when it is actually type y (row y). The classification is performed on a cross-validation dataset as explained in the methods. The average percentage of correct classification, obtained by averaging the diagonal of each matrix, is shown on the top of each confusion matrix. These numbers are used in the plot of Figure 11A. Abbreviations are defined in Figure 3.

