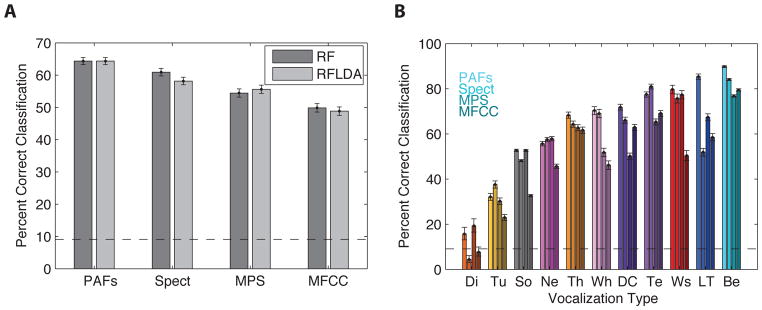
Figure 11. Performance of the Random Forest (RF) and Regularized Fisher Linear Discriminant Analysis (RFLDA) for all vocalization types and for each feature space.
A. Average performance of each classifier across all vocalization types. The error bars are confidence intervals obtained from a binomial fit of the classification performance on cross-validated data. The dotted horizontal line is the chance level (1/11). B. Performance of the RFLDA for each vocalization type. A gradient of darkness (from light to dark) is used to represent the four feature spaces: Predefined Acoustical Features (PAFs), Spectrogram (Spect), Modulation Power Spectrum (MPS) and Mel Frequency Cepstral Coefficients (MFCC). The vocalization types on the x-axis are sorted in ascending order according to the percent of correct classification obtained with the Spectrogram feature space. Abbreviations are defined in Figure 3.

