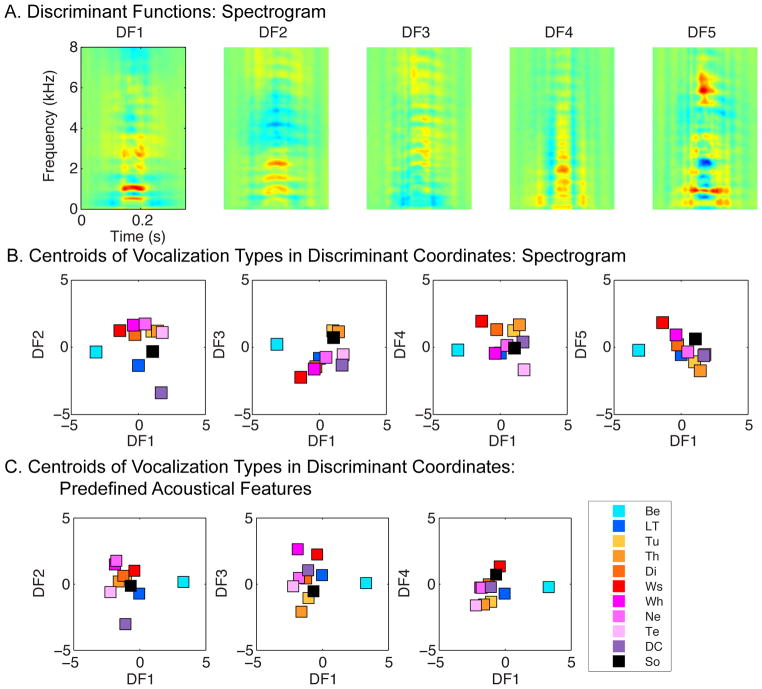
Figure 12. Discriminant Functions (A) and positions of vocalization types in Discriminant coordinates (B and C).
A. The first 5 discriminant functions (DF) obtained in the RFLDA applied to the spectrogram feature space. These discriminant functions are displayed in a spectrographic representation. Each vocalization was then represented in RFLDA coordinates by projecting its spectrogram onto these Discriminant functions (using a vector dot product). B and C. The average position of each vocalization type (centroid) is shown as a colored rectangle in coordinate-pair scatter plots. The DF have been scaled so that the within vocalization type variance along each discriminant dimension is equal to 1. In B the positions of the centroids obtained from the RFLDA applied on the spectrogram feature space are shown. In C the positions of the centroids obtained from the RFLDA applied on the Predefined Acoustical Features are shown. Vocalization abbreviations are defined in Figure 3.

